
829 Athol Street, Whitby, ON
Downtown Whitby, Whitby · MLS® E13464742
About this home
In short
- Discover the charm and potential of this inviting bungalow at 829 Athol St, ideally positioned in one of Whitby's most desirable neighbourhoods.
- Situated on a generous corner lot, this property offers a rare blend of comfort, privacy, and opportunity.
- The backyard is designed for elevated everyday living, featuring a private inground pool and a fully fenced yard, perfect for summer entertaining and relaxed family...
Discover the charm and potential of this inviting bungalow at 829 Athol St, ideally positioned in one of Whitby's most desirable neighbourhoods. Situated on a generous corner lot, this property offers a rare blend of comfort, privacy, and opportunity.The backyard is designed for elevated everyday living, featuring a private inground pool and a fully fenced yard, perfect for summer entertaining and relaxed family moments. Inside, the home offers a warm, functional layout with endless potential to personalize and create your ideal space.Enjoy the convenience of being just minutes from top rated schools, parks, shopping, and transit, making day to day living effortless.Whether you are a first time buyer, investor, or looking to customize a home to your vision, this is an exceptional opportunity to own in a highly sought after community.
Key facts
- Property type
- Detached, Bungalow
- MLS®
- E13464742
- Bedrooms
- 2+1 (3 total)
- Bathrooms
- 2
- Size
- 700-1100 sq ft
- Lot
- 54 × 119 ft
- Cross streets
- Brock St S & Burns St E
- Parking
- 1 garage · 5 parking (detached)
- Driveway
- Private
- Basement
- Partially Finished
- Heating
- Forced Air
- A/C
- Central Air
- Exterior
- Vinyl Siding
- Foundation
- Concrete
- Roof
- Asphalt Shingle
- Sewer
- Sewer
- Pool
- Inground
- Property tax
- $5,502 / 2025
- Days on market
- 93
- Listing brokerage
- EXP REALTY
Listed at $648,800 with no offer date. Homes here have been closing close to ask, so my read is $660K, typically $622K to $649K. Comparable closings on their own put this home around $699K, which supports the ask, so this is a firm read.
Compared as a project. The listing presents this home as one to renovate or rebuild, so the finished homes among its comparable sales were adjusted for that before comparing.
Total price vs nearby homes. Likely closing about $660K, from 23 recent closings in this pocket.
The market behind the math:
About 0.7 months of inventory: 5 detached homes for sale in the area against 23 closings in the last 90 days. Under two months favours sellers, over four favours buyers.
Price per square foot: this home lists at $721/sqft against an area asking average of $834/sqft. Size and $/sqft both feed the estimate above.
- Corner lot. Two street frontages: more to landscape, shovel and mow, and more exposure to traffic, wind and headlights at night. Buyers price that against an interior lot on the same street, so I read this one on the cautious side and confirm the setting in person.
- Inground pool. Priced into the comparison on the assumption it is clean and modern. A pool costs more to build than resale pays back, and condition is the in-person call.
How this estimate is builtthe short version
This figure comes from a model built on about 44,000 recent GTA sales. It weighs this home’s tax assessment, size, age, location and features against what homes like it actually sold for, including sales in this neighbourhood.
It never sees the asking price. The 23 most comparable recent sales on their own, adjusted for size, beds, baths and lot, point to about $661K. Condition and finishes remain an in-person call.
What the listing highlights2 points to weigh
Claims from the listing, worth confirming in person. I can book you a private showing.
- Pool: lifestyle appeal, but adds maintenance, insurance, and resale is mixed. Weigh carefully
- Corner lot: more light and frontage, sometimes at the cost of privacy. Weigh carefully
Read this with carewhy it’s an estimate, not an appraisal
The listing states size as a wide range, so the size adjustment is approximate and this estimate is a rough read. I can confirm exact square footage to tighten it.
Based on 23 comparable homes that sold in Downtown Whitby over the past two years, from 164 closings there.
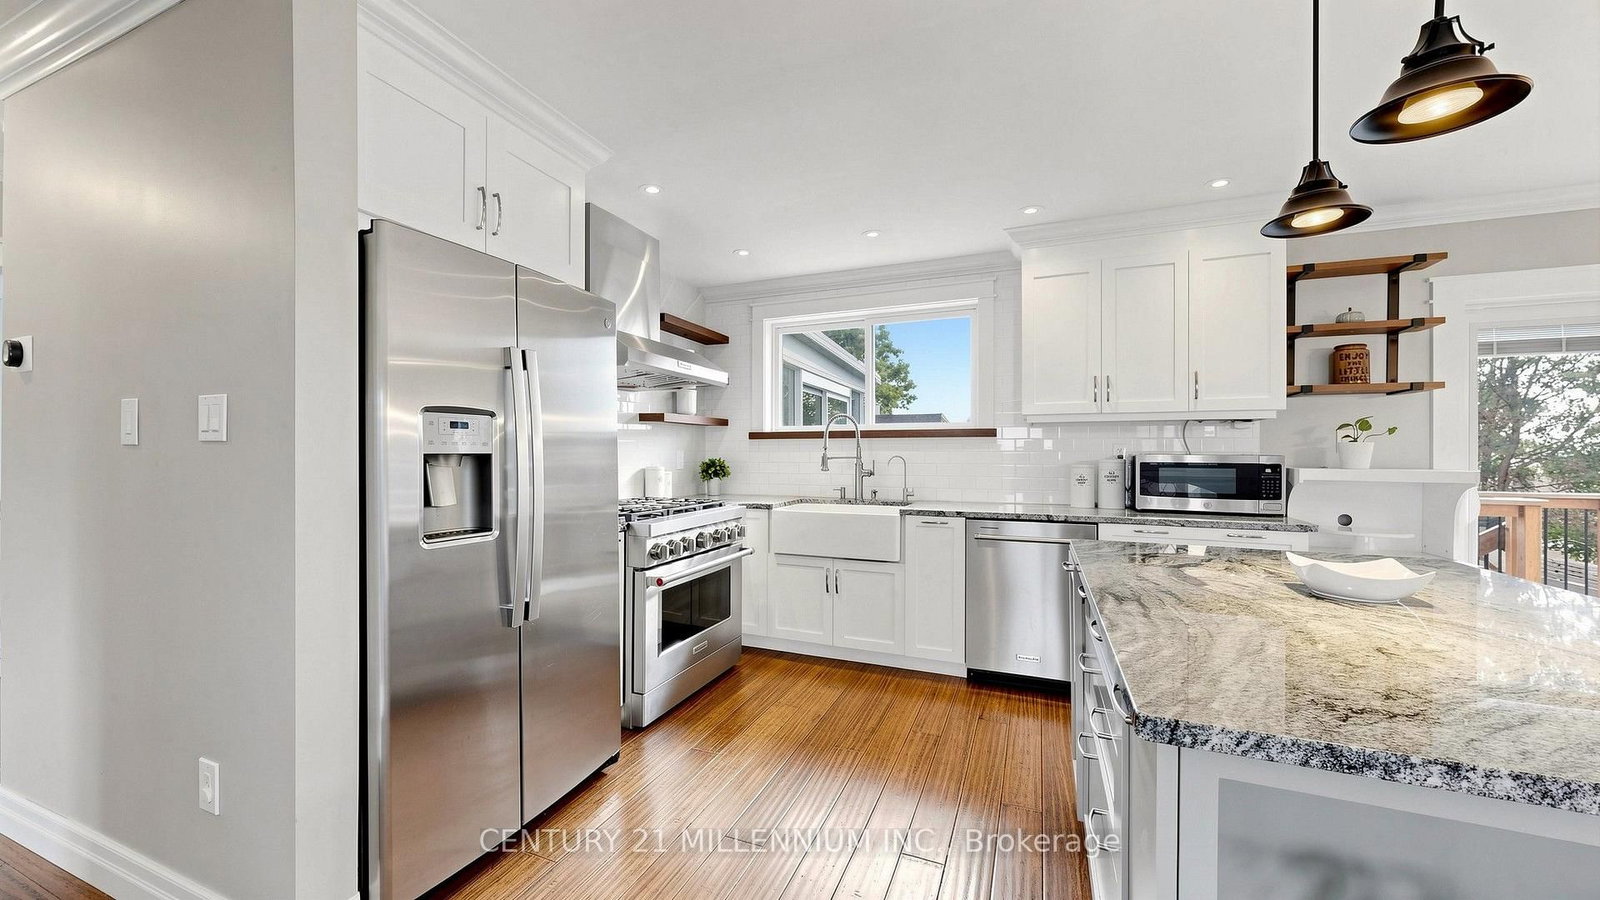
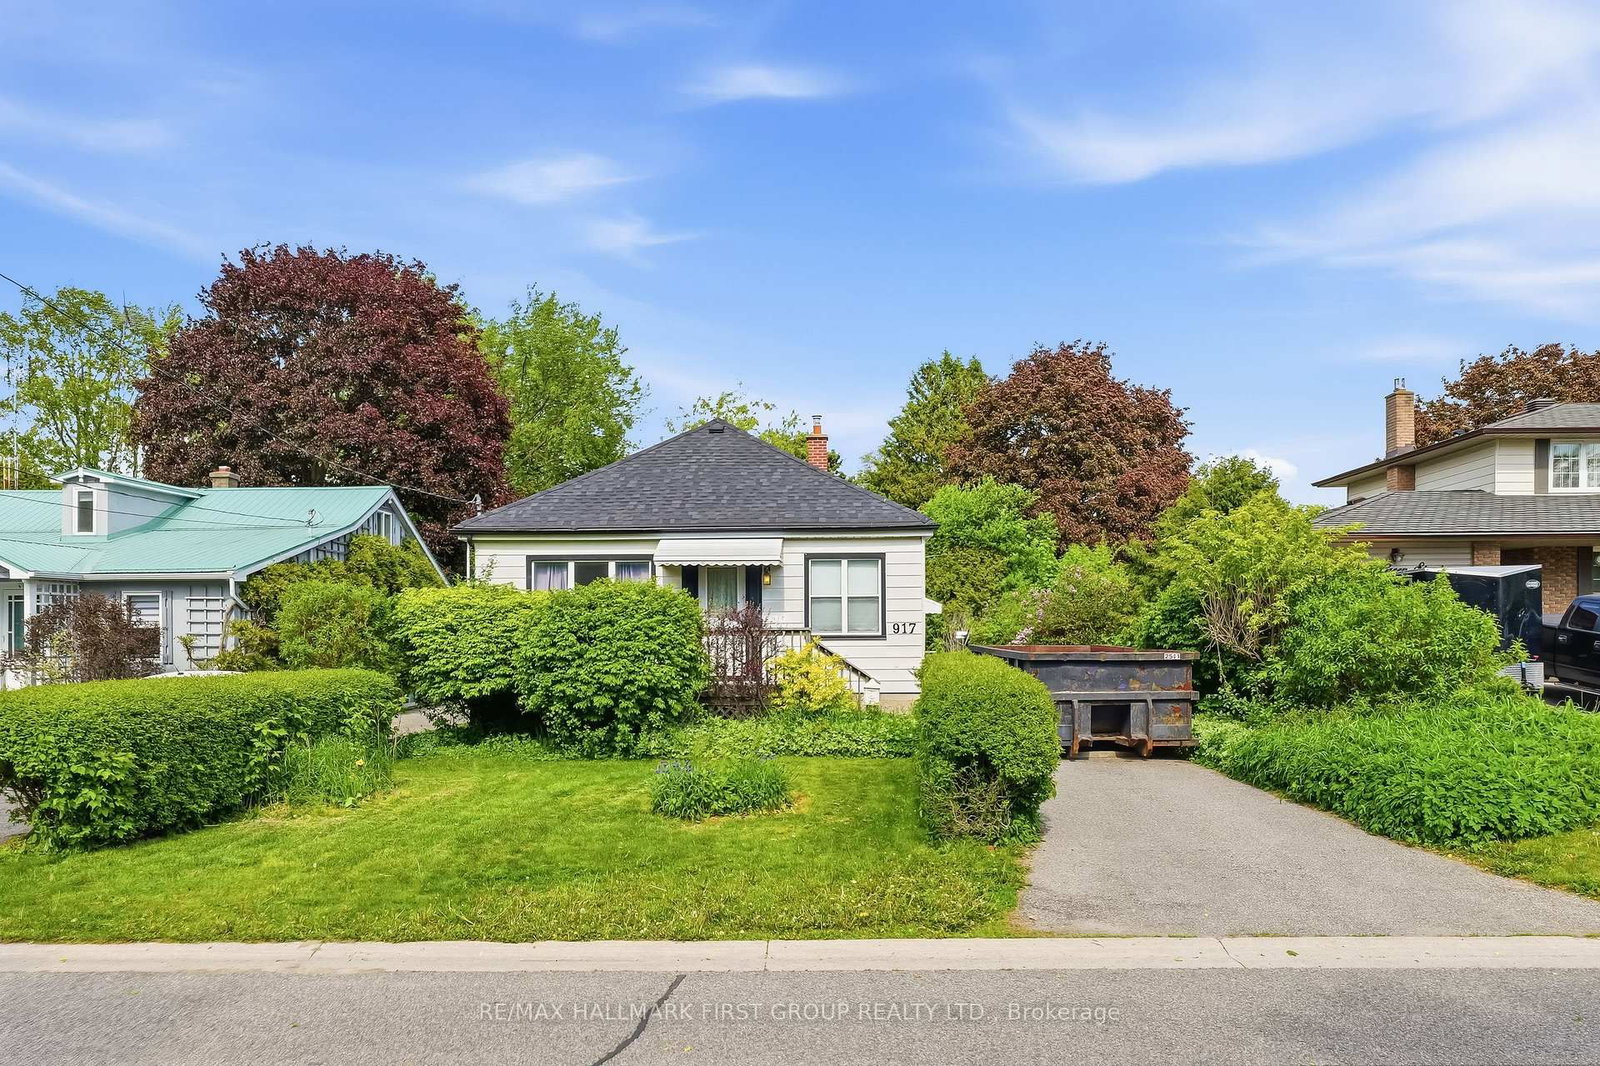

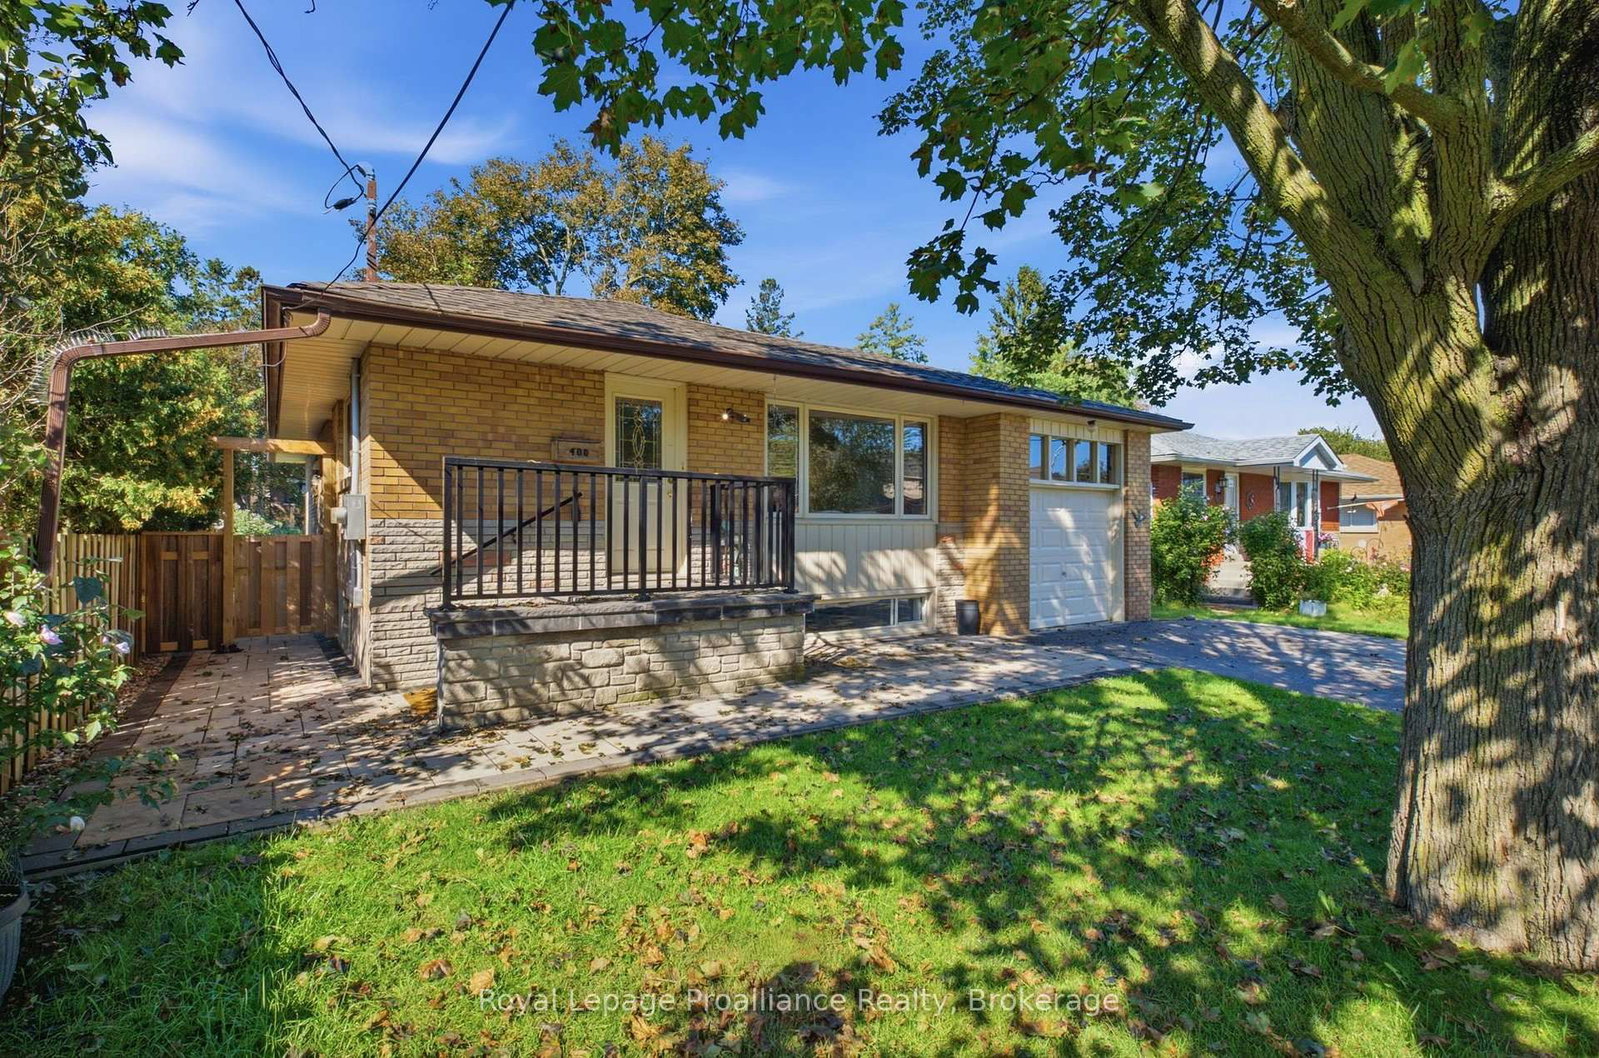

The closest active listings by size, beds, and price, so you can see what this home is up against.
Per square foot, these ask about $834/sqft; this home lists at $721/sqft. Size is part of the price story, not just the sticker.
The 5 closest active listings nearby.
See all comparable homesNeighbourhood & location
Downtown Whitby, Whitby, ON
Enter a workplace or destination and we’ll show the door-to-door time by car, transit and bike.
How asking prices compare in the closest areas to this home. Longer bars mean a pricier market.
Typical asking price of active listings of the same type, per area (outliers removed). Whitby.
Get the full neighbourhood report (schools, parks, transit & safety) →
Affordability & Mortgage
Income needed assumes a ~32% GDS ratio; weekly is mortgage principal & interest only. Price ÷ income is the home price over the income needed. Fixed reference assumptions so listings compare on equal footing, not a lending decision.
Calculate and customize your mortgage and other expenses
Adjust the down payment, rate, and amortization, and add property tax, condo fees, and heating to see your true monthly cost.
Your numbers
Conventional (20%+ down). Best insured 5-year fixed 4.24% via Ratehub.ca (as of September 18, 2026); conventional rates run a little higher.
Mortgage amount $519,040 · 4.39% over 25 years
Total monthly cost
- Mortgage payment (monthly equivalent)
- $2,841
- Property tax
- $459
- Condo / maintenance fees
- $0
- Heating
- $0
- Estimated monthly cost
- $3,300
Add your own property tax, condo fees, and heating on the left for a sharper total.
One-time closing costs
- Ontario land transfer tax
- $9,451
- Estimated closing costs
- $9,451
Plus your down payment of $129,760. Legal fees, title insurance, and adjustments are extra and vary by deal.
Mortgage stress test
Lenders qualify you at the greater of your rate plus 2% or 5.25%. You do not pay this rate. It just shows you could still handle payments if rates rose, so aim to stay comfortable at this higher number.
Over the full 25 years
At the end of your 5-year term
- Total paid over the term
- $170,465
- Principal paid down
- $64,175
- Interest paid
- $106,290
- Balance remaining
- $454,865
Talk to Team Asgarian about your options
Rates and programs change often. We will connect you with a trusted mortgage professional and build a plan that fits your budget and goals.
Estimates only, not a mortgage quote or pre-approval. Figures use Canadian semi-annual compounding, current minimum down-payment rules, CMHC premium tiers, and Ontario (plus Toronto, when selected) land transfer tax. Actual rates, taxes, insurance, and closing costs vary by lender and property. Confirm every number with your mortgage professional.
Investor snapshot
Thinking of this home as an investment? We will pull real comparable rents and run the full numbers with you.
Talk about the numbersThe last 13 whole-home leases in Downtown Whitby signed at a median of $2,543 a month; adjusted to this home for size, beds and baths, and for where rents stood the month each signed, that is $2,222. The gross yield above is on the asking price, before taxes and upkeep; the cap rate is after them. A finished basement or second suite can push real rent above it. Taxes, fees, and vacancy vary by property, and cap rate is before financing.
Helpful resources
All information deemed reliable but not guaranteed. For personal, non-commercial use only. Listing courtesy of EXP REALTY. MLS®/PropTx.