

As of November 2025, the average Toronto home price has risen about 417% since 1993. Adjusted for inflation alone, the 1993 average would be roughly $397,000 in November 2025 dollars, while the actual average is about $1,060,000. A one bedroom that rented for $627 a month in October 1993 averaged $2,295 in November 2025.
The Blue Jays lost game seven of the 2025 World Series, which sent people looking backward. The last time a Toronto baseball team reached the World Series was 32 years earlier, in 1993, and that team won it. Moe Asgarian is a real estate broker in Toronto with RE/MAX, and the 1993 comparison is one of the clearest ways he has found to show clients what actually happened to this city's housing, because the numbers are not close.
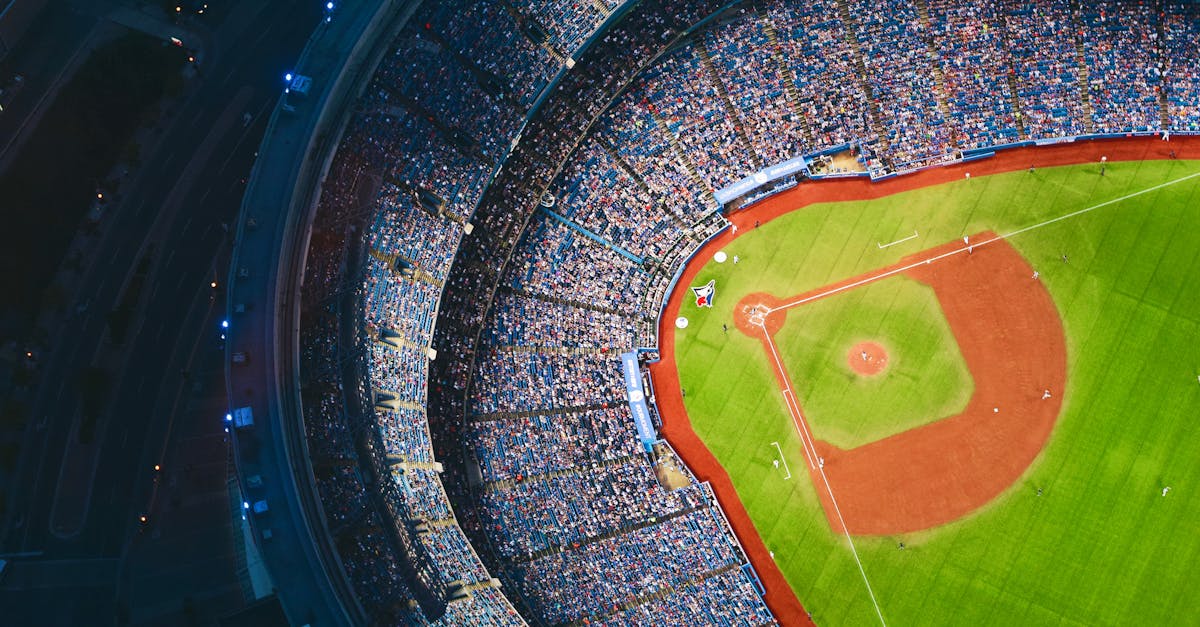
What a Toronto home cost in 1993, and what it costs now
Plenty changed in the 32 years between 1993 and 2025. The city's big stadium was called SkyDome then, and as of 2025 it has long been known as the Rogers Centre. Roughly $400 million has gone into renovating that building alone.
Housing changed harder. Take the 1993 average Toronto home price and apply the inflation rate to it, and you land around $397,000 in November 2025 dollars. The actual average price was about $1,060,000 as of November 2025. Comparing 1993 with 2025 gives a 417% increase. Inflation accounts for a part of that and nothing like all of it, which is the whole point of running the comparison.
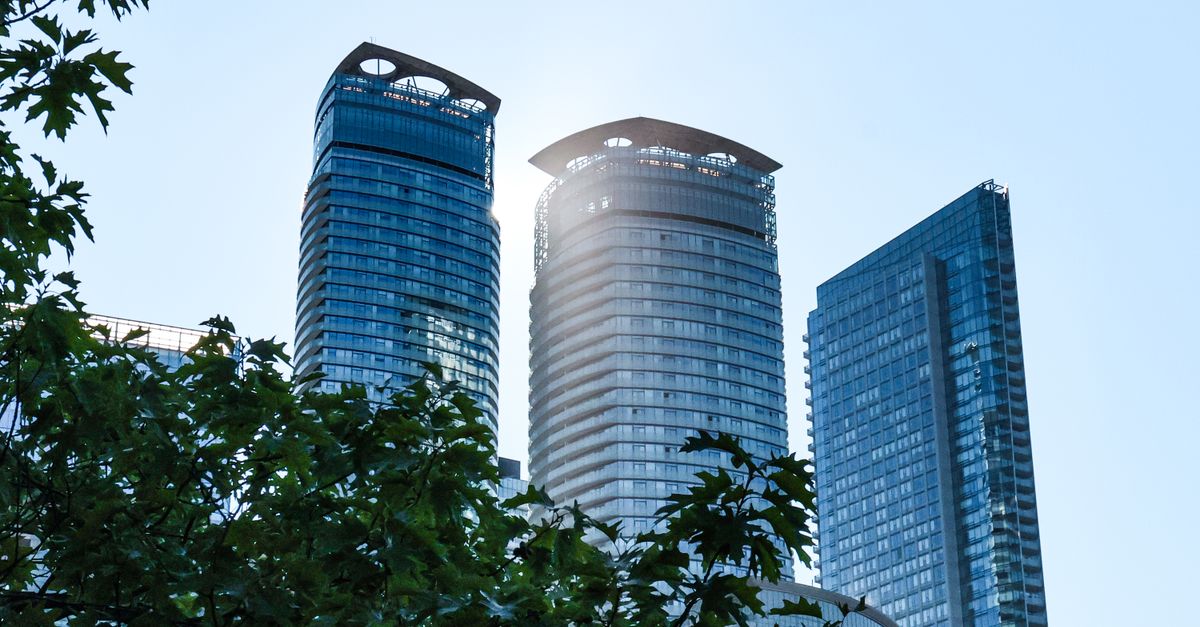
Rents rose faster than inflation too
The rental side tells the same story in smaller numbers. In October 1993, the average one bedroom apartment in Toronto rented for $627 a month. As of November 2025, the average one bedroom rent was $2,295, and a two bedroom was close to $2,940.
Worth remembering the context of the 1993 figure. Canada was in a heavy recession in the early 1990s. Even so, buying a home was possible for a lot of families. That combination, a bad economy and attainable housing, is the thing that felt foreign by late 2025.
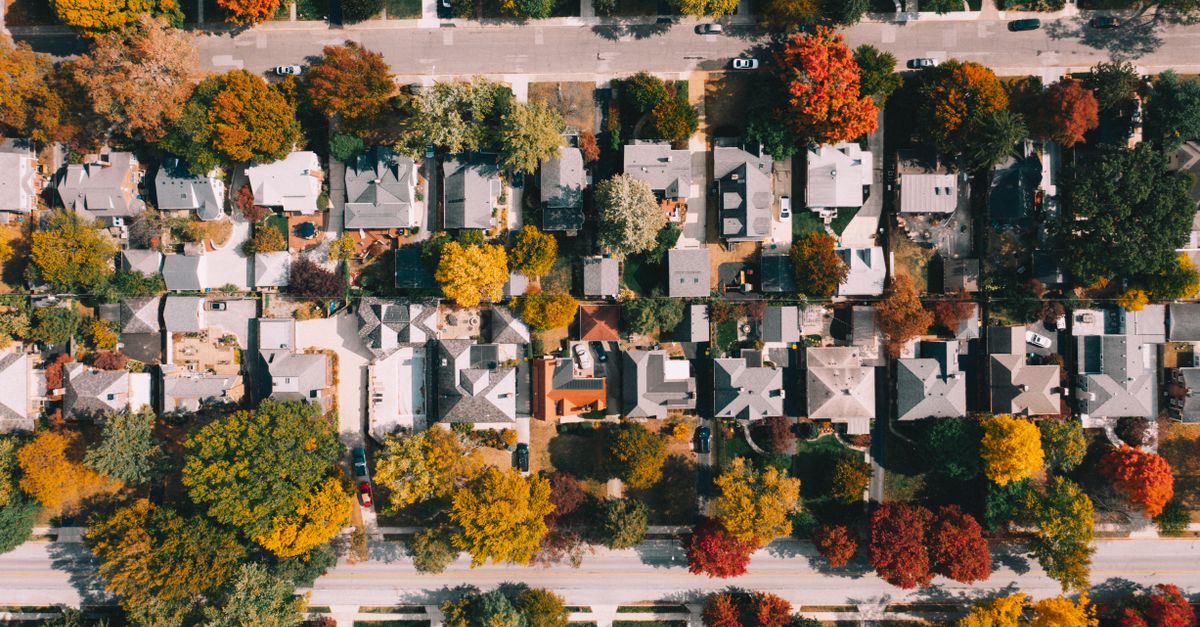
Zoning kept supply down in Toronto's house neighbourhoods
So what happened in those 32 years? Land got dramatically more expensive. In residential areas where single family houses sit, permission to build more was simply not granted, and that pushed land values up. As of 2025, a large share of Toronto is still zoned for detached or single unit homes, and you cannot easily put a multi unit building in places like Riverdale, Leslieville or Lawrence Park.
This is the part I would push back on hardest when someone blames the price of a Leslieville house on buyers. Tower construction in Toronto has been heavy, no question. But many residential house neighbourhoods look much as they did in the year the Blue Jays last won the World Series. If you forbid new supply on most of the land, the land you are allowed to buy gets expensive. That is not a market failure, it is a rule working as written.
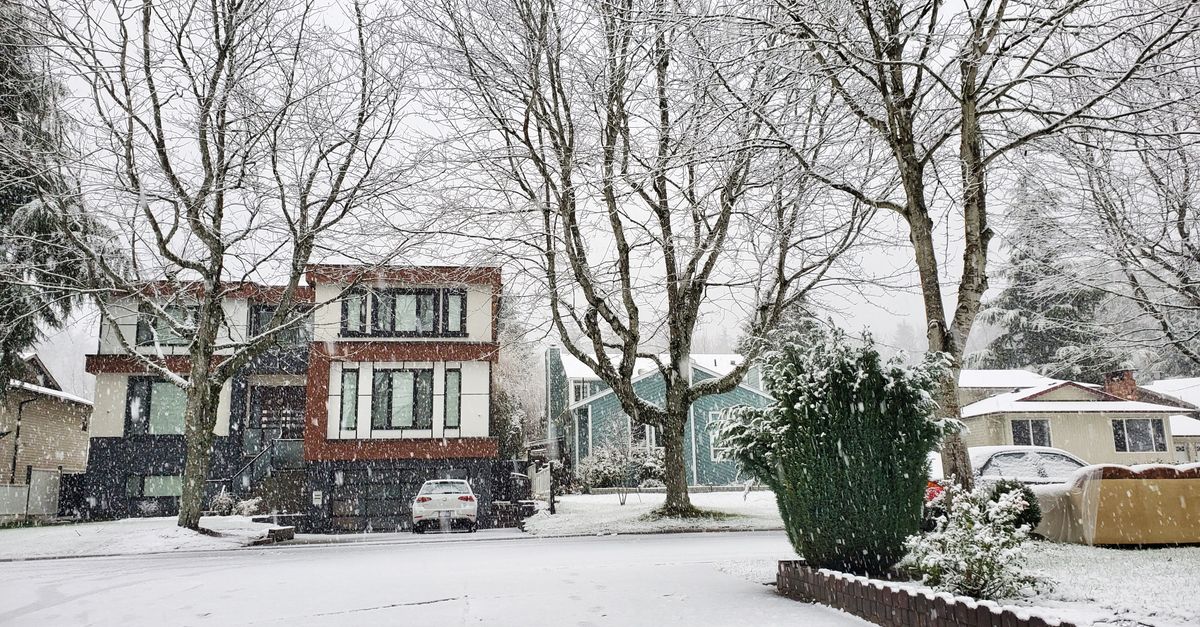
Richmond Hill, Aurora and Newmarket face tighter limits
That description is only Toronto. Outside the city, in Richmond Hill, Aurora and Newmarket, the situation as of 2025 is considerably worse. Single family zoning covers close to the entire municipality in those places, so the pressure valve that tower construction provides inside Toronto barely exists.
Beyond land, material and construction costs also rose over the same period. Those two together, expensive land and expensive building, set a floor under the price of anything new, and the price of new housing pulls the price of existing housing along with it.
Houses got bigger while condos got smaller
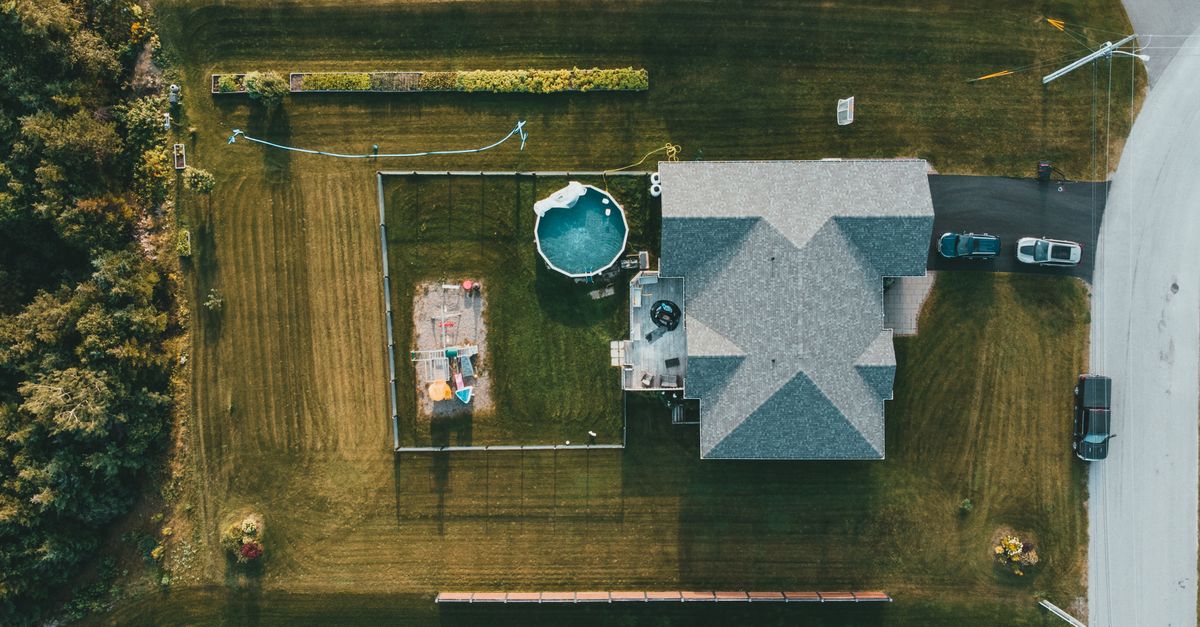
Here is a reason the average price rose that has nothing to do with scarcity: the homes themselves grew. In the 1970s the average single family detached house was about 1,300 square feet. As of 2025 it is about 2,400. A bigger house costs more, so the average price climbs even when the price per square foot behaves.
Condos went the other direction. Average condo size has shrunk from around 960 square feet to considerably less as of 2025. Anyone comparing an average price from 1993 to an average price from 2025 is comparing two different products, and that is worth holding in mind before drawing conclusions from the headline number alone.

Population grew but incomes did not keep up
The last piece is demand. The population of the Toronto area was about 4.6 million in 1993 and was about 7.6 million as of 2025. More people competing for a housing stock that most neighbourhoods were not allowed to expand produces exactly the prices that market has.
The problem is that price growth badly outran income growth. Average income in 1993 was about $48,000, which is roughly $90,000 in November 2025 dollars if you only account for inflation. The actual average income as of November 2025 was about $61,000. That gap is the real story of Toronto housing, and it is why buying got harder every year rather than easier. As of November 2025, the average Toronto home price sat at about 12 times a $100,000 annual salary, and a buyer earning that would need to put about 77% of it toward the mortgage payment.
Two conclusions come out of the comparison. Since the Blue Jays last won the World Series, housing has got far more expensive than inflation alone can explain. And buying a home has become harder for Canadians with each passing year.
If you want to know where your own numbers land in this market, fill out the form at the bottom of this page or book a free consultation, and we will go through it together. Stay well and take care.
Frequently asked questions
How much have Toronto home prices risen since 1993?
Comparing 1993 with 2025, the average Toronto home price rose about 417%, reaching roughly $1,060,000 as of November 2025. Inflation alone would have taken the 1993 average to about $397,000 in November 2025 dollars. The difference between those two figures is the part of the increase that inflation does not explain.
Why did Toronto house prices rise so much faster than inflation?
Several forces stacked on each other between 1993 and 2025. Land values climbed because much of Toronto stayed zoned for single family houses, so multi unit buildings could not be built in large areas. Material and construction costs rose. Average detached house size grew from about 1,300 square feet in the 1970s to about 2,400 square feet as of 2025, which raises the average price by itself. And the population of the Toronto area went from about 4.6 million in 1993 to about 7.6 million as of 2025.
How affordable is a Toronto home on a $100,000 salary?
As of November 2025, the average Toronto home price was about 12 times a $100,000 annual salary, and a buyer earning that amount would need to set aside about 77% of it for mortgage payments. For comparison, average income in 1993 was about $48,000, which is roughly $90,000 in November 2025 dollars, while the real average income as of November 2025 was about $61,000.