

As of July 2025, the Greater Toronto Area housing market turned in its best month since 2021. Toronto Regional Real Estate Board figures for July 2025 showed roughly 6,100 sales, 10.9% more than in July 2024, with the average selling price at about $1,051,000, down 5.5% year over year. Lower prices and lower borrowing costs pulled buyers back.
I am Moe Asgarian, a Principal Real Estate Broker in Toronto with RE/MAX, ranked 47th worldwide inside the company. In July 2025 I was listing and selling in North York, North Richvale and Oak Ridges, so the figures below line up with what I was seeing on my own deals that month.
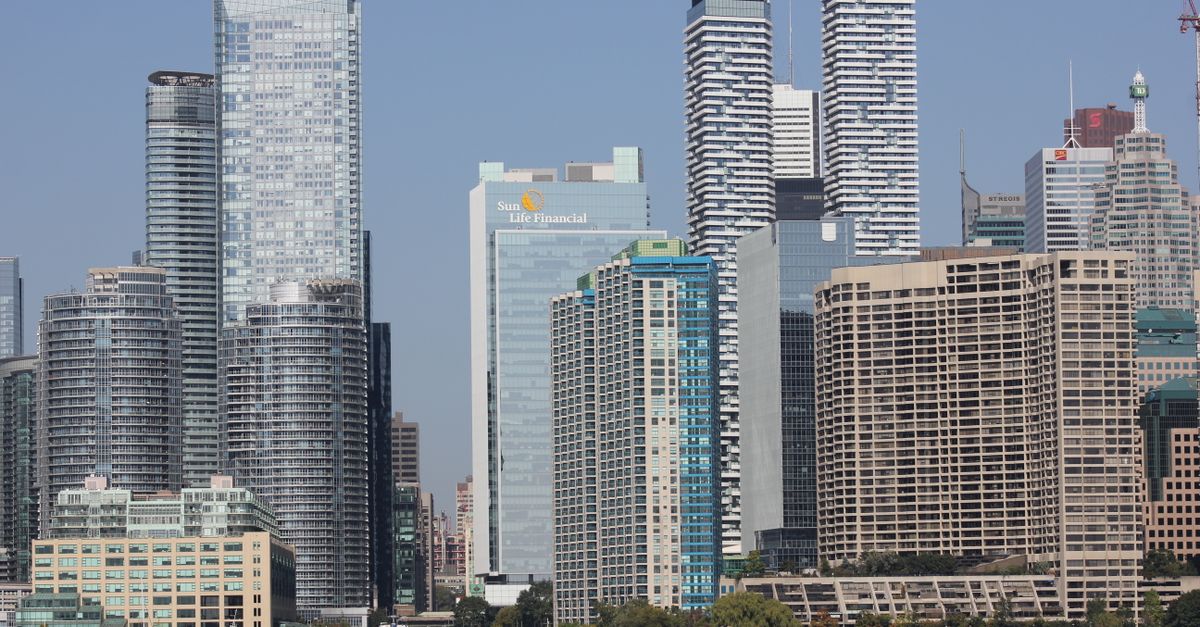
What the July 2025 GTA numbers actually said
Start with the three figures that matter. In July 2025 the Toronto Regional Real Estate Board recorded about 6,100 home sales across the region, 10.9% above July 2024. New listings reached 17,613 in July 2025, 5.7% higher than July 2024. Listings in July 2025 went up compared with June 2025, but sales went up faster, and that is the part the headlines about falling prices left out.
In July 2025 the ratio of sales to new listings also improved against July 2024. In plain terms, in July 2025 more of what came to market actually traded. Better affordability, driven by softer prices and cheaper borrowing than in 2024, showed up as completed deals rather than as higher prices. My own view in July 2025 was that rates still needed to come down further, but more families were clearly finding homes that worked financially.

Prices in July 2025: average, benchmark and median
In July 2025 the MLS Home Price Index composite for the GTA was down 5.4% from July 2024. The average selling price in July 2025 was about $1,051,000, which was 5.5% below July 2024 and roughly unchanged from June 2025.
The benchmark price, which represents the most popular type of home, went from $995,000 in June 2025 to $981,000 in July 2025, a drop of $14,000 in a single month. In July 2025 that same benchmark was down $116,000 against July 2024, and it sat about $400,000 below the peak of March 2022. The median price fell from $950,000 to $910,000 between June 2025 and July 2025.

For a family buying in July 2025, every one of those lines was good news. For a seller moving up in July 2025, the discount cut both ways: the home being sold was worth less, and so was the next one, and at higher price points that second discount is usually the bigger number.
Why more than 30,000 active listings made it a buyer's market
Inventory was the other half of the July 2025 story. In July 2025, active listings across the GTA passed 30,000, a count without precedent in the previous 12 years, and relative inventory in July 2025 was the highest in 12 years as well. The board's own expectation, published alongside the July 2025 data, was no jump in prices through the end of 2025.
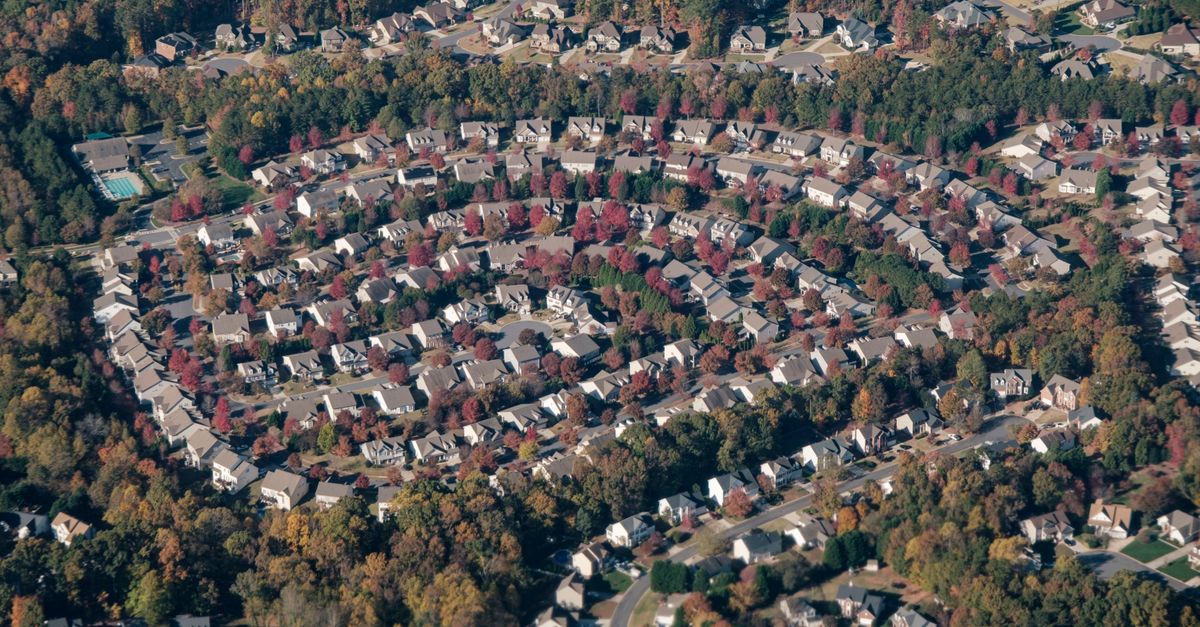
The sales-to-new-listings ratio stood at 34.7% in July 2025. The Bank of Canada treats anything under 40% as a market tilted toward buyers. My read, which I gave here earlier in 2025 as well, is that when the ratio sits that low it can take a year or even longer for conditions to swing back. That is my judgement, not a forecast from the board.
What the July 2025 data meant if you were selling
Two things from July 2025 are worth keeping. First, July 2025 transactions came in higher than July of 2024, 2023 and 2022, and July and August are normally among the quietest months of the year for deal count after December and sometimes January. Even against the hot market of 2022, July 2025 was stronger. Buyers had not left. Buyers were looking for a sensible number, and where sellers gave one, the home sold.

Second, of the homes that sold in 2025 up to July 2025, 70% sold within the first 30 days on market, and the July 2025 data showed the chance of selling drops off sharply after 60 days. Sellers call me and say they want to come off the market for two months and try again. Nobody can predict the market, but with the sales-to-listings ratio where it stood in July 2025, delaying mostly means carrying the home longer, paying more to hold it, and selling for less at the end.
If your home has had the full marketing list behind it, open houses where you were comfortable with them, online advertising, everything an agent should do for a listing, and there was still no offer in the first 30 days, then the price is the only thing left to review. Ask yourself what you would pay for your own home today, against every other option a buyer can see right now. And if the sale is not truly necessary, July 2025 was not a seller's market. July 2025 was a buyer's market, with a very large number of listings to choose from.
What I saw in my own July 2025 listings
In July 2025, correct pricing still got paid. In July 2025 I listed a North York home at $2,098,000, took three offers inside three weeks and sold it at $2,073,000, which is $25,000 off the asking price. An end-unit townhouse in North Richvale sold in July 2025 in under a month at $1,019,000, while two comparable end-unit townhouses on the same street were still sitting on the market unsold in July 2025.
In Oak Ridges, a detached home I listed sold in July 2025 for $1,400,000. A comparable four-bedroom on the same street, on the market at the same time as ours in July 2025, sold for $1,315,000. Same street, same month, two different results. Pricing and sale strategy are what sat between those two numbers.
If you are a seller whose home did not sell, or you pulled it off the market, or you simply want a second opinion on price, fill out the form at the bottom of this page or book a free consultation and we will go through your numbers together. The same goes if you are buying and want to take advantage of a market like the one July 2025 described. Stay well and take care.
Frequently asked questions
How many homes sold in the GTA in July 2025?
The Toronto Regional Real Estate Board recorded about 6,100 home sales across the Greater Toronto Area in July 2025, which was 10.9% more than in July 2024. New listings in July 2025 came in at 17,613, up 5.7% from July 2024, so sales grew faster than new supply.
What was the average GTA home price in July 2025?
The average selling price in the Greater Toronto Area was about $1,051,000 in July 2025, 5.5% below July 2024 and close to flat against June 2025. The benchmark price in July 2025 was $981,000, down $116,000 from July 2024 and roughly $400,000 below the March 2022 peak.
Was the Toronto market a buyer's market or a seller's market in July 2025?
It favoured buyers. In July 2025 the sales-to-new-listings ratio in the GTA stood at 34.7%, and the Bank of Canada treats a ratio under 40% as a market tilted to buyers. Active listings in July 2025 passed 30,000, the highest relative inventory in 12 years.