
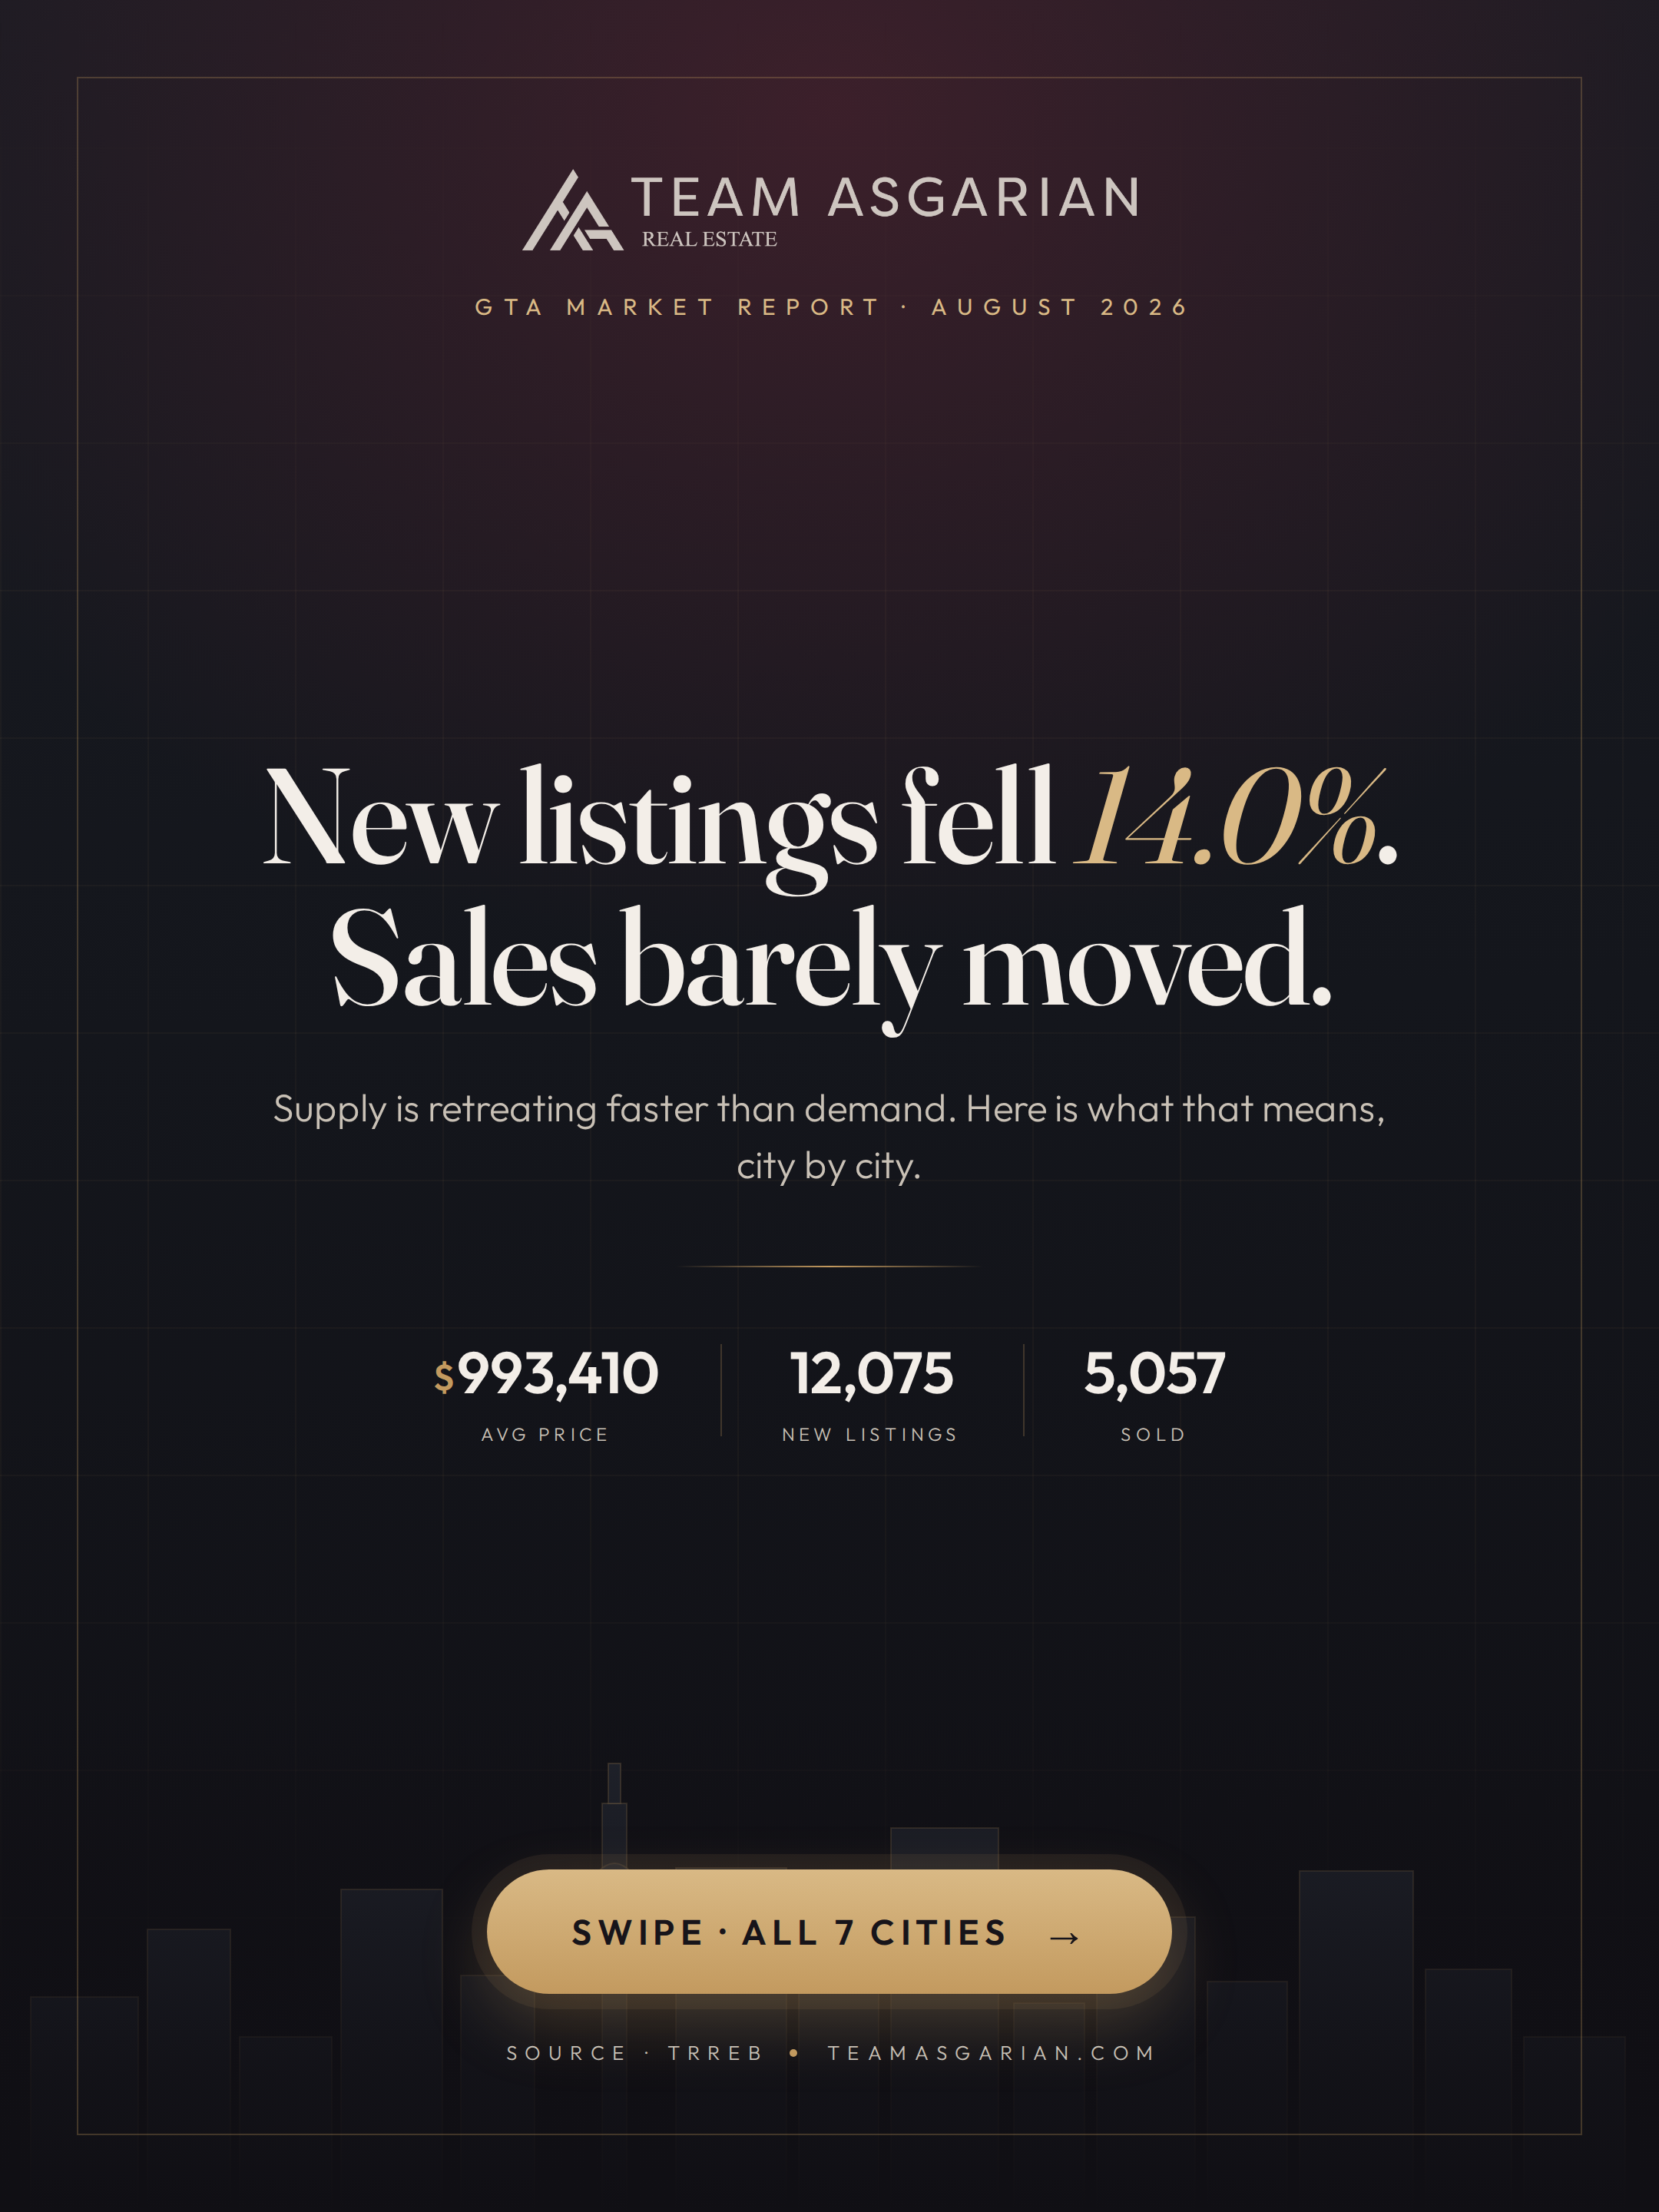
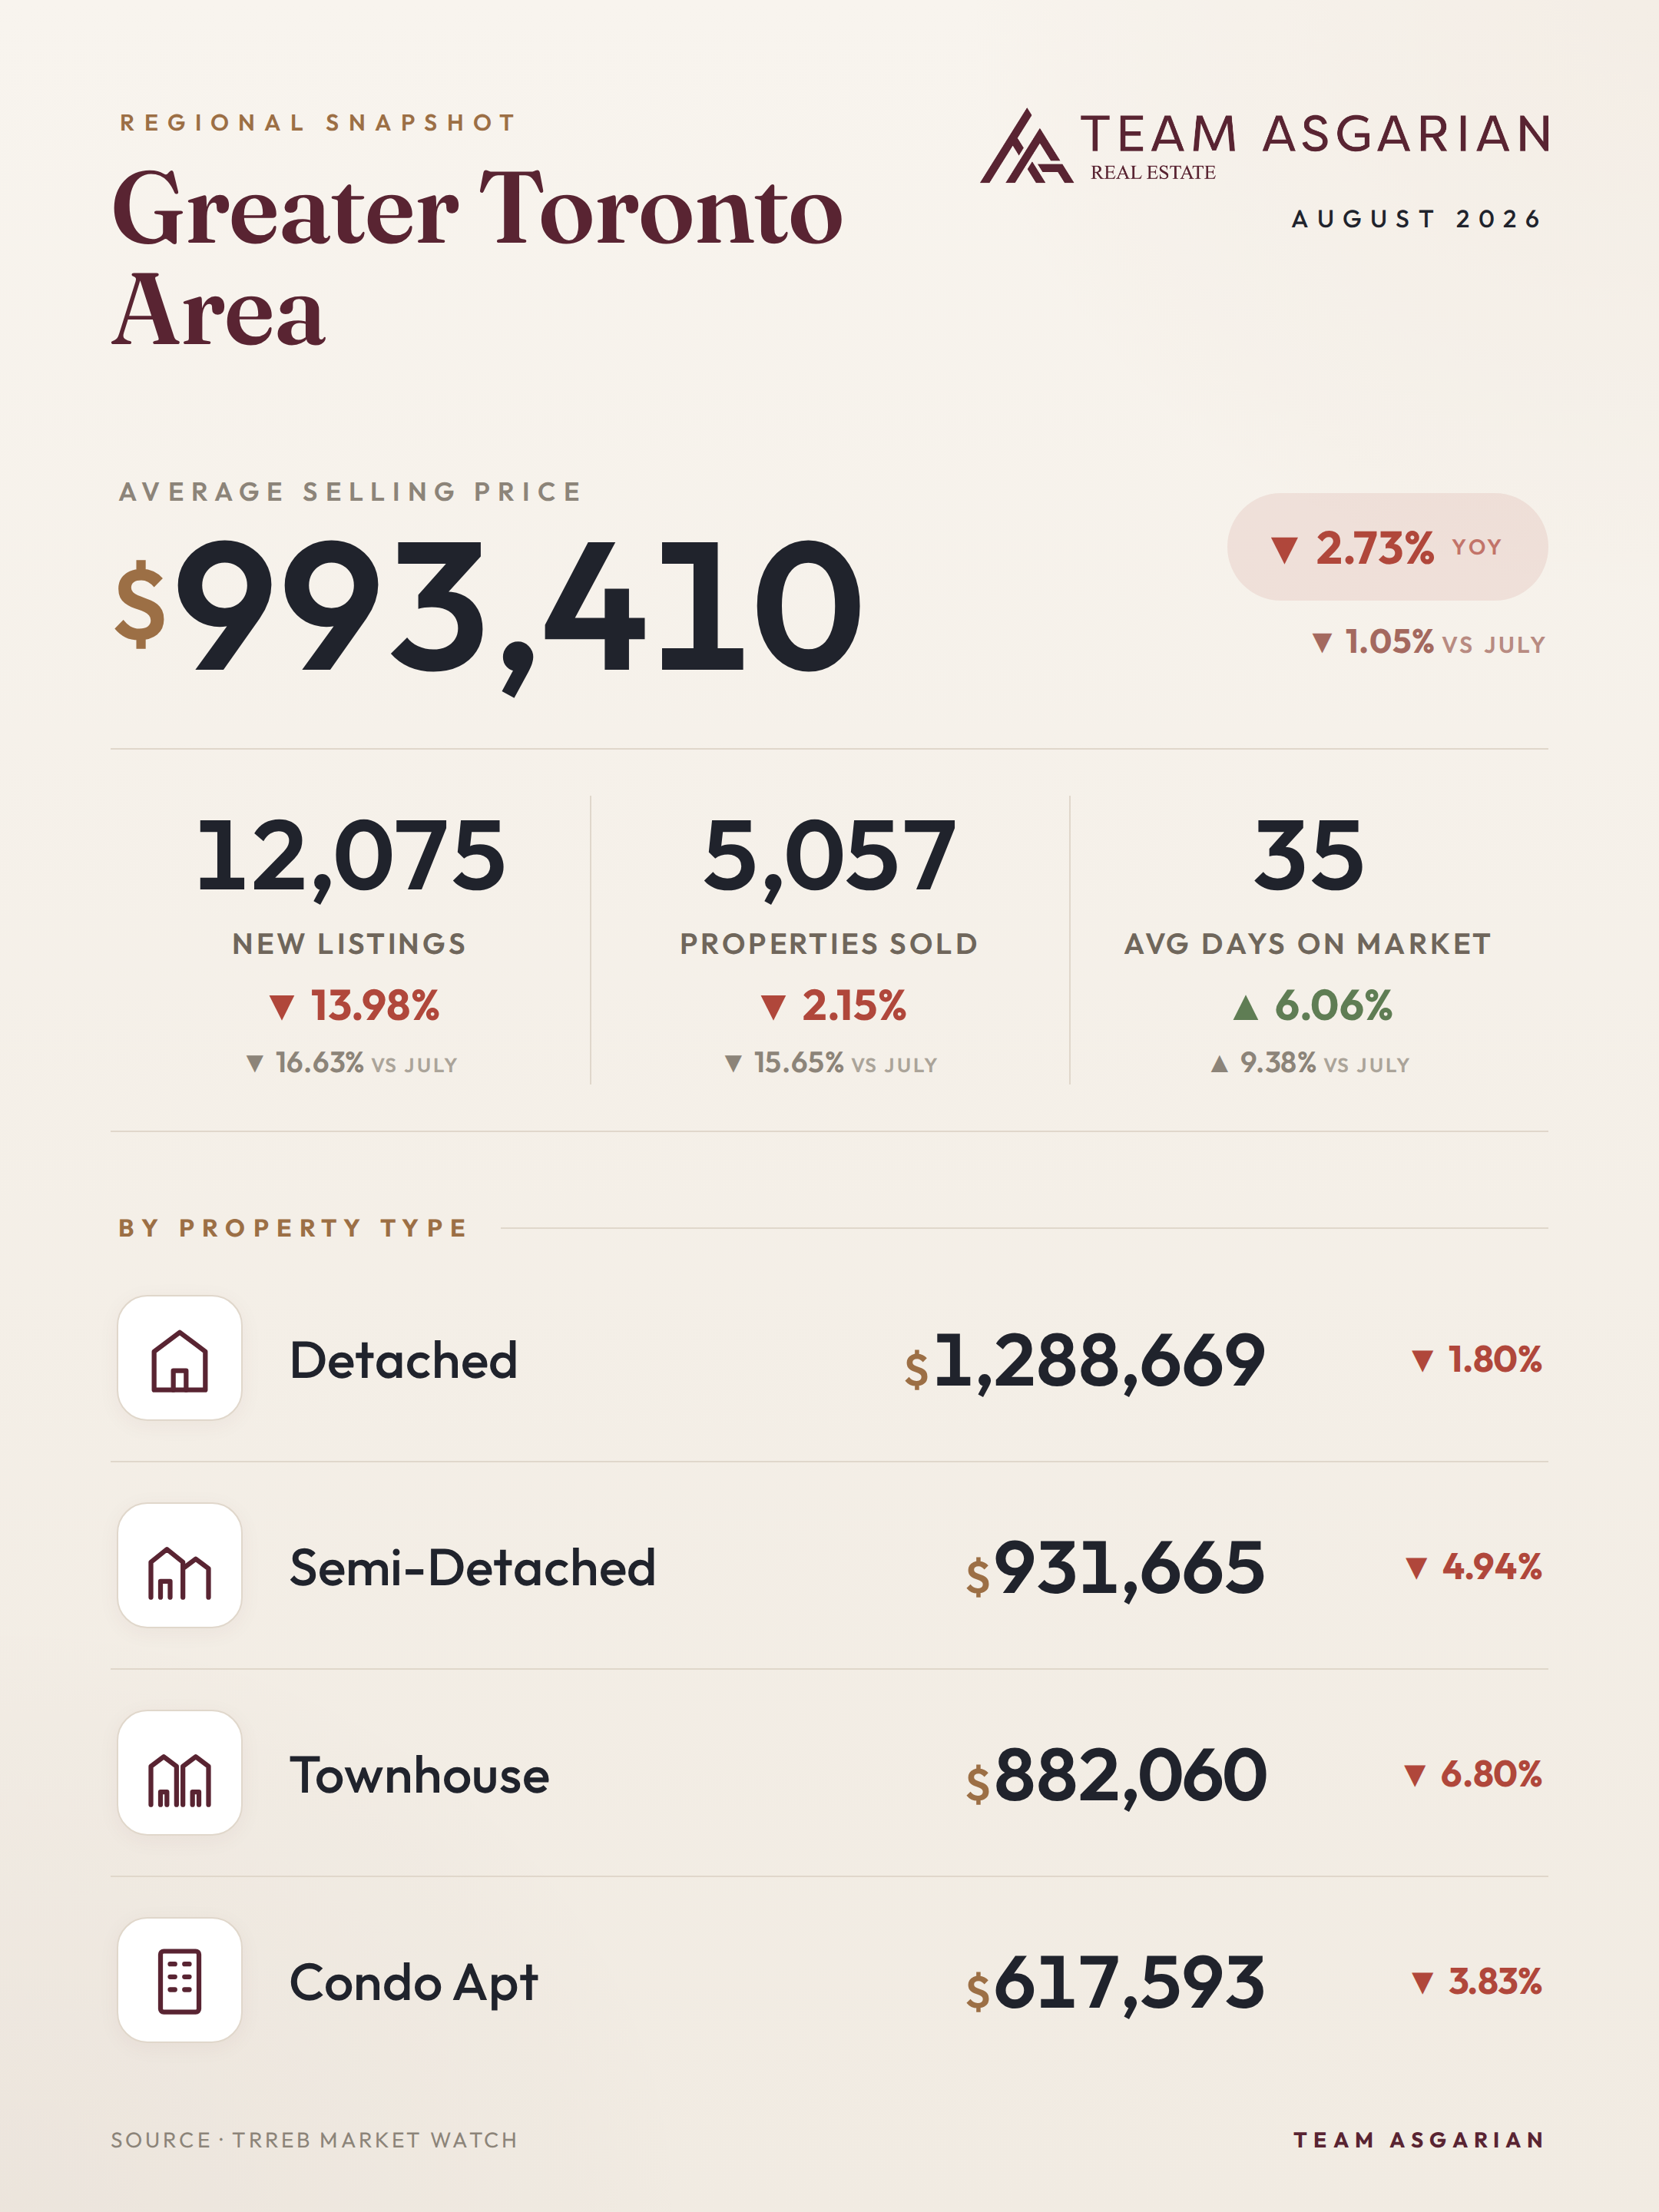
The GTA finished August 2026 at an average sale price of $993,410. Down 2.73% from last August, down 1.05% from July. That's the number that will show up in every headline, and read on its own it looks like a market giving ground. The number sitting underneath it is the one I'd actually pay for.
New listings fell 13.98% year over year to 12,075. Sales fell 2.15%, to 5,057. Supply is walking out of this market a lot faster than demand is. A year ago about 37% of new listings turned into a sale. This August it was closer to 42%. Sellers blinked harder than buyers did.

So: softer prices and a tighter balance, at the same time. Homes are taking 35 days on average, up from about 33 last year. And the weakness is parked in townhouses (-6.8%) and semis (-4.94%), not detached, which held at $1,288,669 and gave back just 1.8%. City by city, here is what that does to you if you're buying or selling this fall.
What the August GTA numbers do to your plans
Every property type in the GTA is down year over year. Not by the same amount though, and that gap is the whole story. Detached at $1,288,669 is off 1.8% and basically flat month over month at -0.23%. Condo apartments at $617,593 are down 3.83%. Townhouses got hit hardest at $882,060, down 6.8%, which is what happens to a segment that ran hot through the cheap-money years and is still paying that premium back.

Buying? The leverage is real, just narrower than the headline suggests. 5,057 sales against 12,075 new listings works out to roughly two and a half homes sitting on the market for every one that sells. At 35 days, you get to see a place twice, bring in a proper inspection, and write a conditional offer without watching it evaporate under five competing bids.
Selling, that listing drought is doing you a favour. Fewer than 12,100 new listings came out in August, down 16.63% from July alone, so you have less company on your street than you've had in years. Just leave the 2025 expectations at home. The market is paying about 2.73% less than it did a year ago, and buyers walk through everything else nearby before they write a single thing.

By the numbers for Greater Toronto Area, August 2026: average selling price $993,410 (-2.7% year-over-year); 5,057 homes sold (-2.1%); 12,075 new listings (-14.0%); 35 average days on market. By type: Detached $1,288,669 (-1.8% YoY, -0.2% vs prior month), Semi-Detached $931,665 (-4.9% YoY, -3.5% vs prior month), Townhouse $882,060 (-6.8% YoY, -2.4% vs prior month), Condo $617,593 (-3.8% YoY, -2.9% vs prior month).
Toronto is holding better than the 905, with one glaring exception
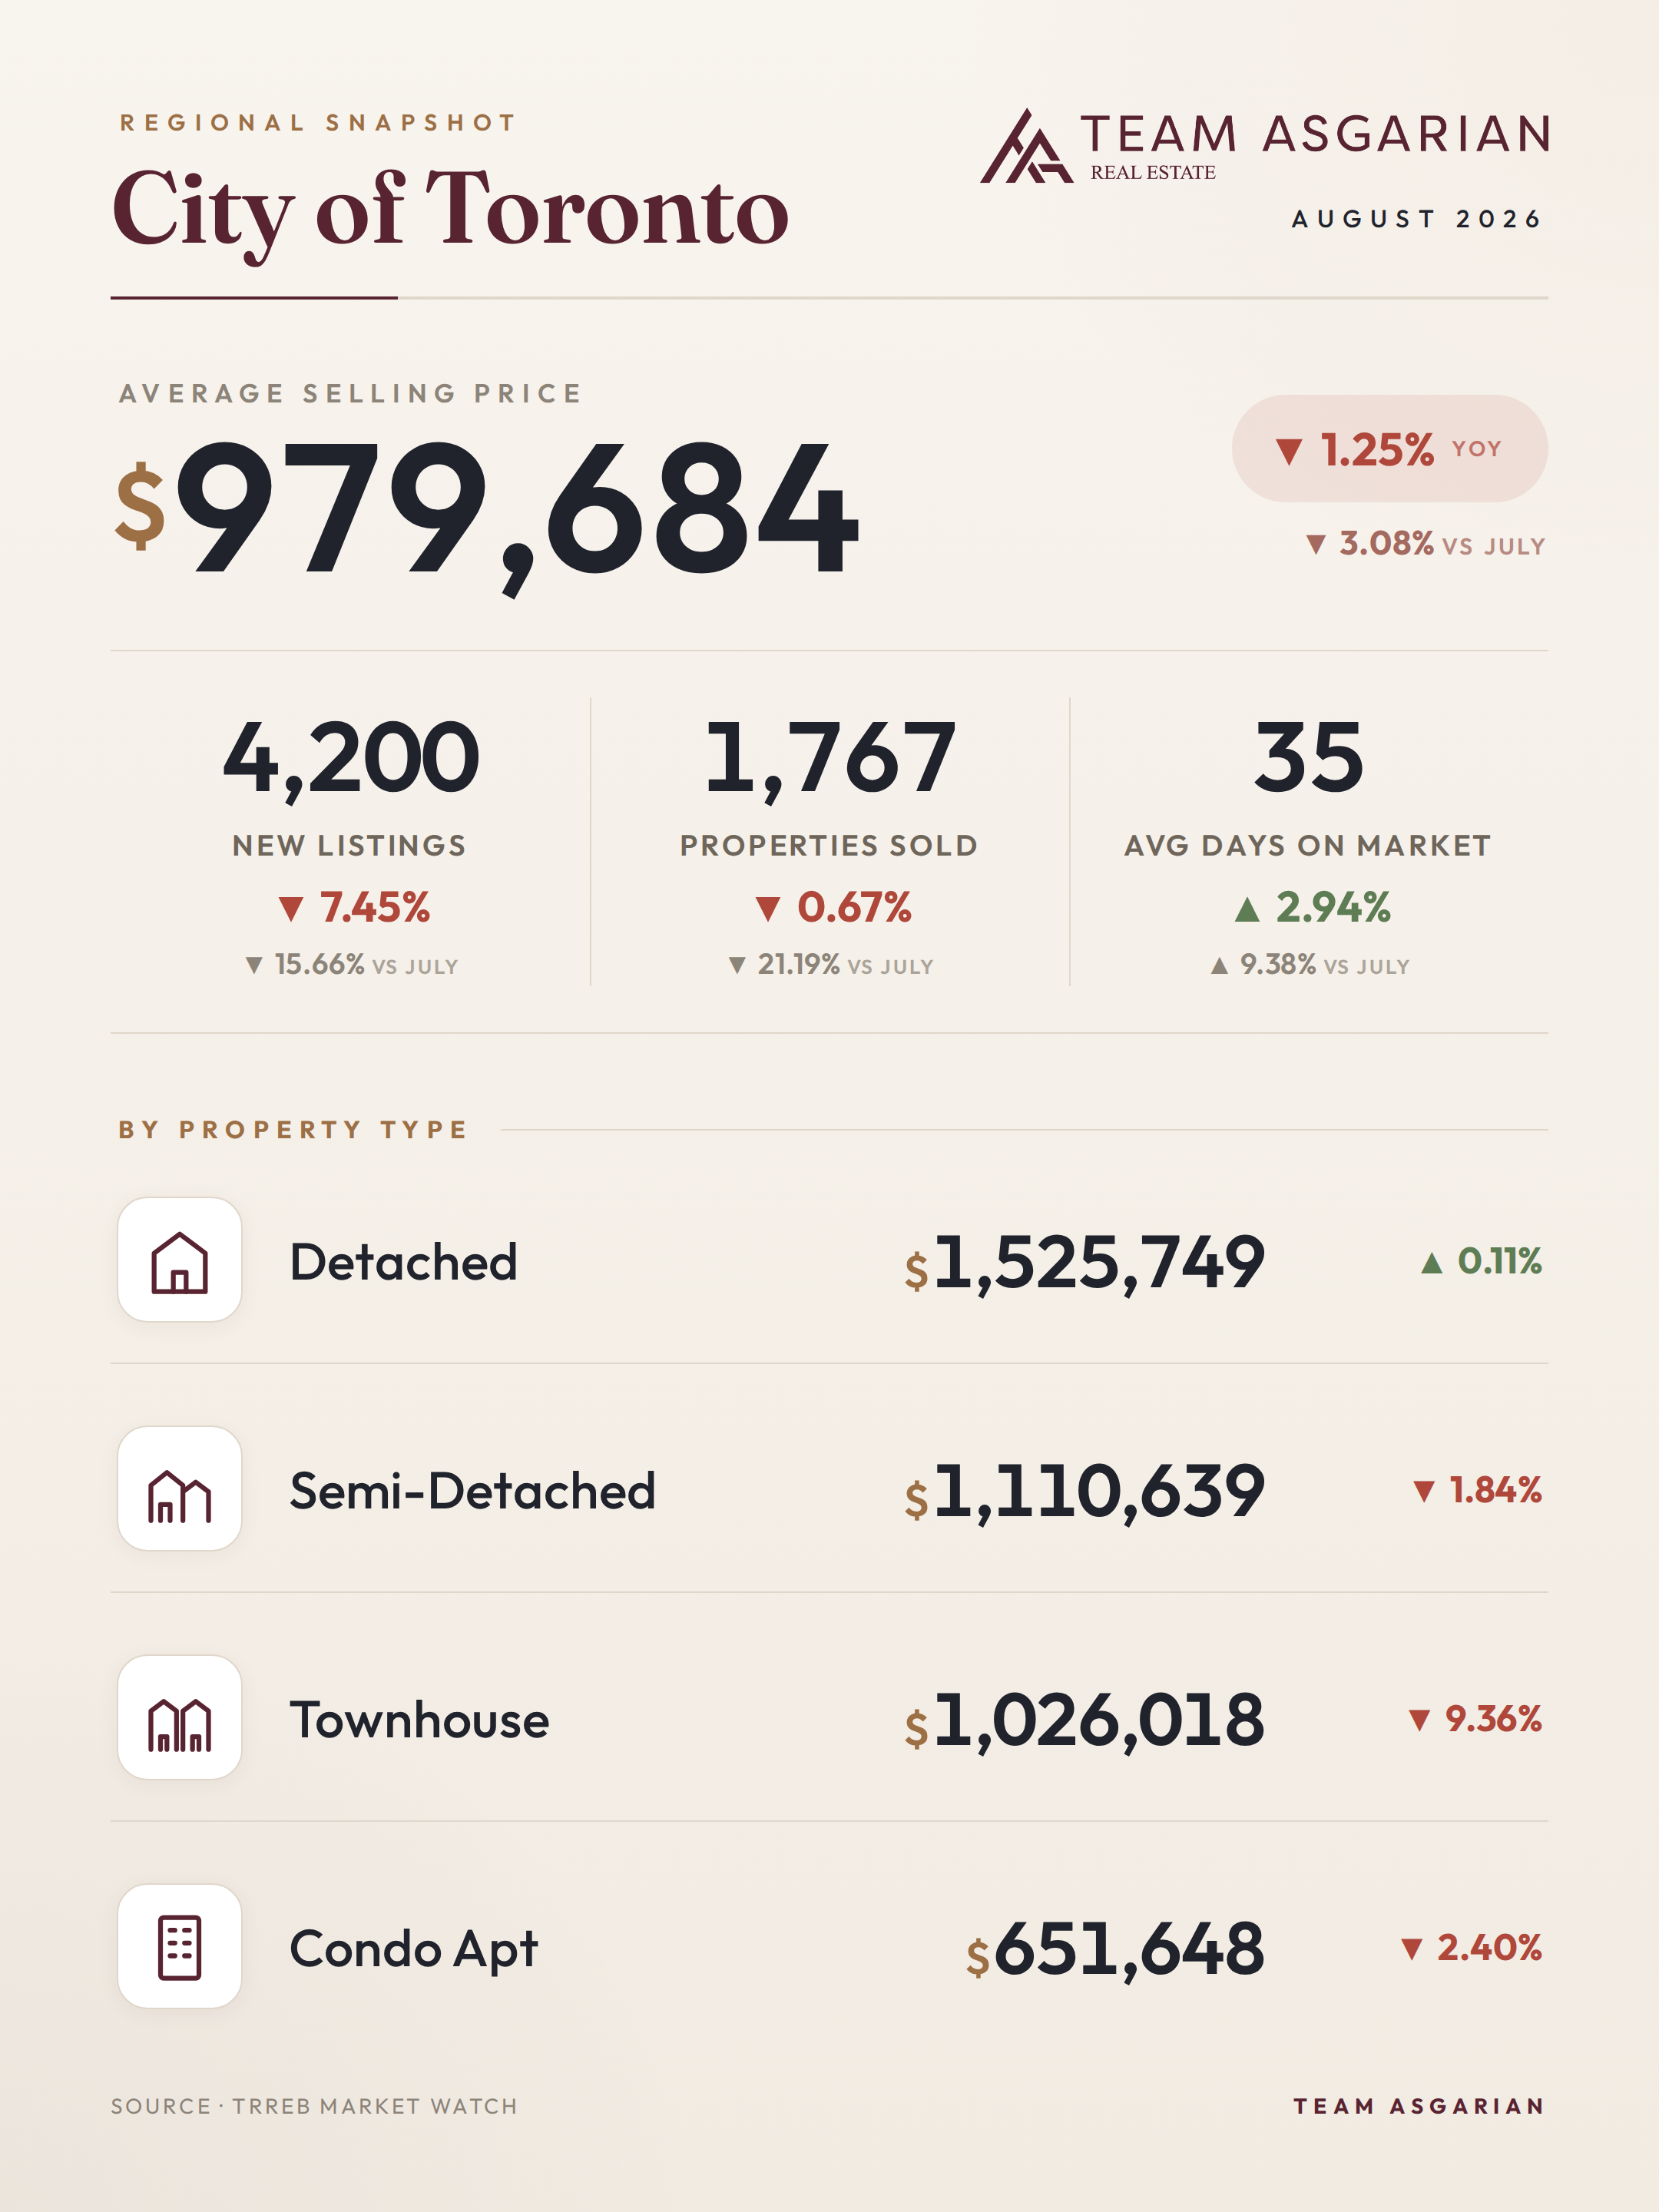
Toronto's average of $979,684 is down only 1.25% year over year, the mildest annual decline anywhere in this report. Month over month is a different mood: prices off 3.08% from July, sales down 21.19%, the steepest one-month sales drop in the region. Some of that is just August in the city. Half my clients were at a cottage.
The property-type split is where it gets interesting. Detached at $1,525,749 is up 0.11%, the only Toronto segment that finished the year in the black. Townhouses at $1,026,018 fell 9.36%, the sharpest freehold drop in this report outside Aurora. Condo apartments at $651,648 are down 2.4%, and with 4,200 new listings against 1,767 sales, condo buyers have the widest menu in the GTA by a distance.
For a family chasing detached in Toronto, the entry point hasn't moved and I don't expect it to. For anyone looking at a townhouse or a condo, this is a genuine window. 35 days on market next to a 9.36% correction in freehold towns is not a gap that stays open forever. I've watched one like it close in six weeks.
By the numbers for City of Toronto, August 2026: average selling price $979,684 (-1.3% year-over-year); 1,767 homes sold (-0.7%); 4,200 new listings (-7.5%); 35 average days on market. By type: Detached $1,525,749 (+0.1% YoY, -1.4% vs prior month), Semi-Detached $1,110,639 (-1.8% YoY, -1.0% vs prior month), Townhouse $1,026,018 (-9.4% YoY, -2.0% vs prior month), Condo $651,648 (-2.4% YoY, -3.1% vs prior month).
Vaughan's average jumped 7.87% in one month, and detached did all the lifting
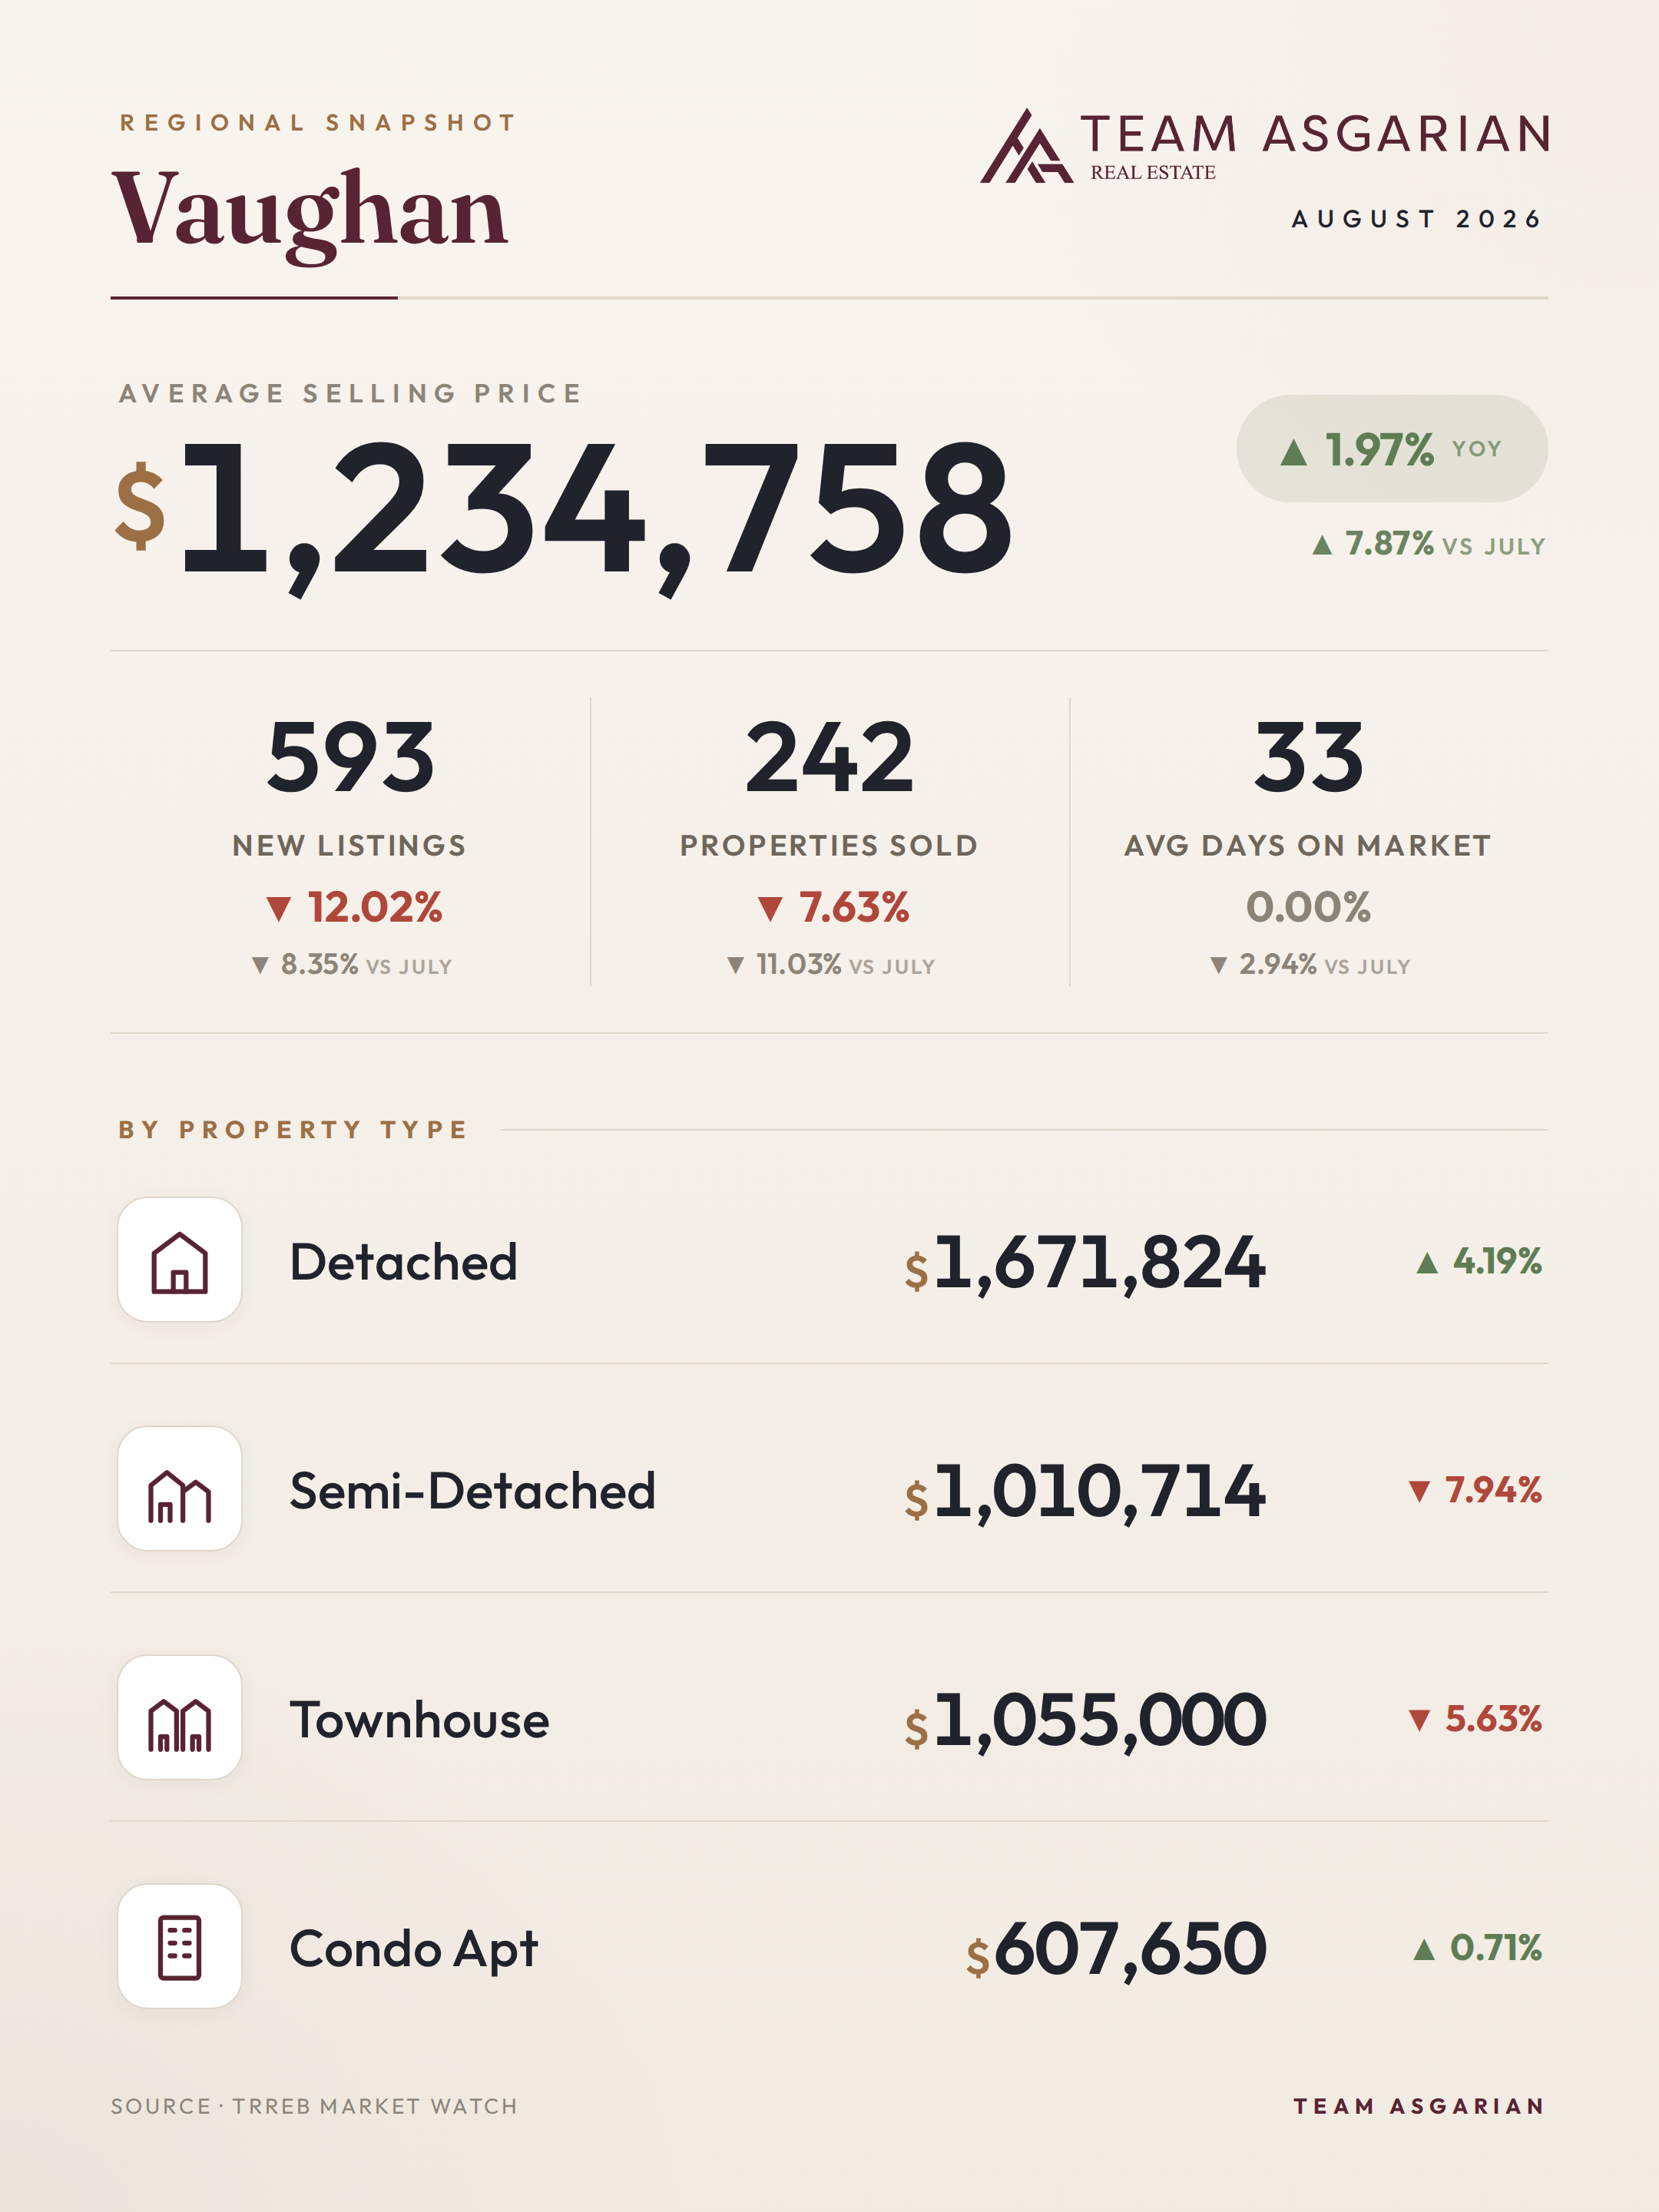
Vaughan is one of only three markets here with a positive year-over-year average: $1,234,758, up 1.97% annually and 7.87% from July. Before anyone opens champagne, look at what moved it. Detached rose 7.29% month over month to $1,671,824, the highest detached average in this report. In a month with only 242 total sales, a handful of big detached deals drags the whole average up with them.

Underneath, it's a mixed bag. Semi-detached at $1,010,714 is down 7.94% year over year. Townhouses at $1,055,000 are down 5.63%. Condo apartments at $607,650 are up 0.71% and now sit below the GTA condo average, which still surprises me for Vaughan. New listings fell 12.02% to 593. Want detached here? You're competing in the firmest segment in York Region. Fine with a semi or a town? You're shopping a market that quietly handed back a year of gains.
By the numbers for Vaughan, August 2026: average selling price $1,234,758 (+2.0% year-over-year); 242 homes sold (-7.6%); 593 new listings (-12.0%); 33 average days on market. By type: Detached $1,671,824 (+4.2% YoY, +7.3% vs prior month), Semi-Detached $1,010,714 (-7.9% YoY, +0.8% vs prior month), Townhouse $1,055,000 (-5.6% YoY, +3.9% vs prior month), Condo $607,650 (+0.7% YoY, +1.4% vs prior month).

Markham sales are up 17.5%, but only half the market is hot
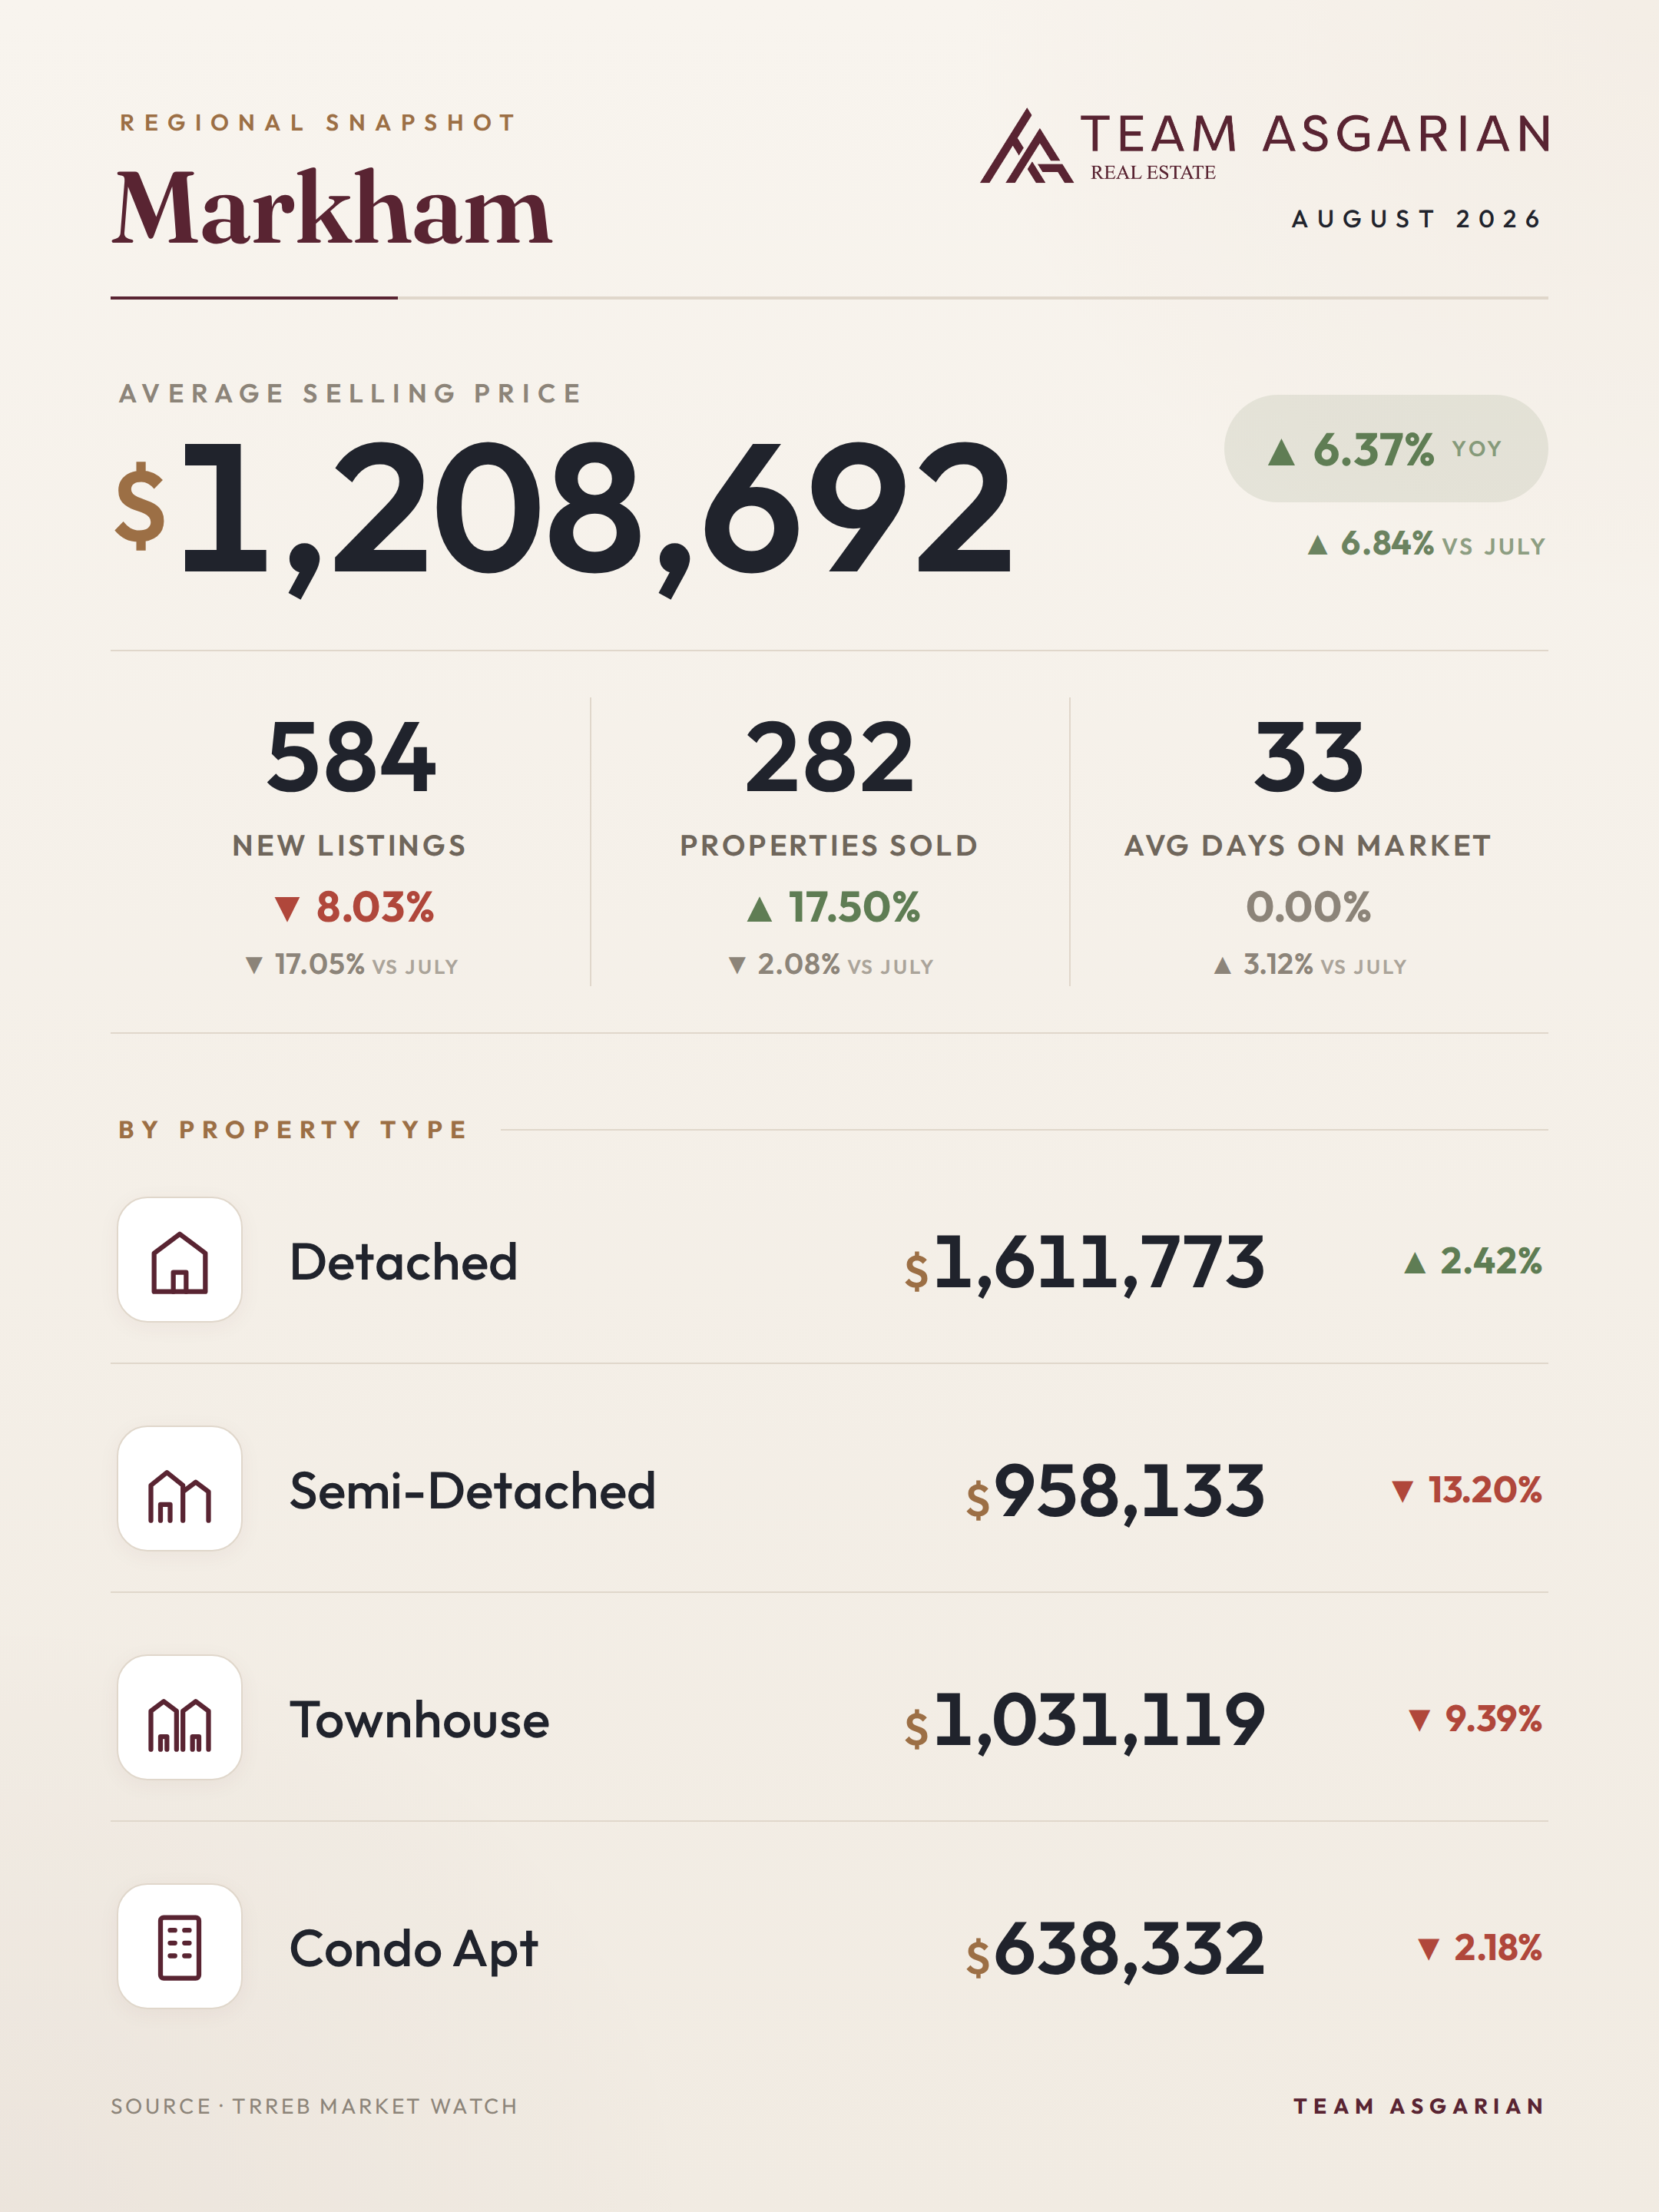
Markham is the volume story this month. 282 homes sold, up 17.5% year over year, against 584 new listings. That's a sales-to-listings ratio near 48%, second only to Newmarket. The average price of $1,208,692 is up 6.37% annually and 6.84% from July, and detached at $1,611,773 gained 2.42% over twelve months and 6.89% in a single one.
That strength stops at the driveway of a detached home. Semi-detached in Markham fell 13.2% to $958,133, the largest annual decline of any semi market in this report. Townhouses dropped 9.39% to $1,031,119. Markham is running as two separate markets right now: detached buyers are in a real fight at 33 days on market, while semi and town buyers have more negotiating room than they've had in years. If the detached side here priced you out, look one rung down. Seriously, look.

By the numbers for Markham, August 2026: average selling price $1,208,692 (+6.4% year-over-year); 282 homes sold (+17.5%); 584 new listings (-8.0%); 33 average days on market. By type: Detached $1,611,773 (+2.4% YoY, +6.9% vs prior month), Semi-Detached $958,133 (-13.2% YoY, -9.6% vs prior month), Townhouse $1,031,119 (-9.4% YoY, -2.7% vs prior month), Condo $638,332 (-2.2% YoY, +0.1% vs prior month).
Richmond Hill went the other way from its neighbours
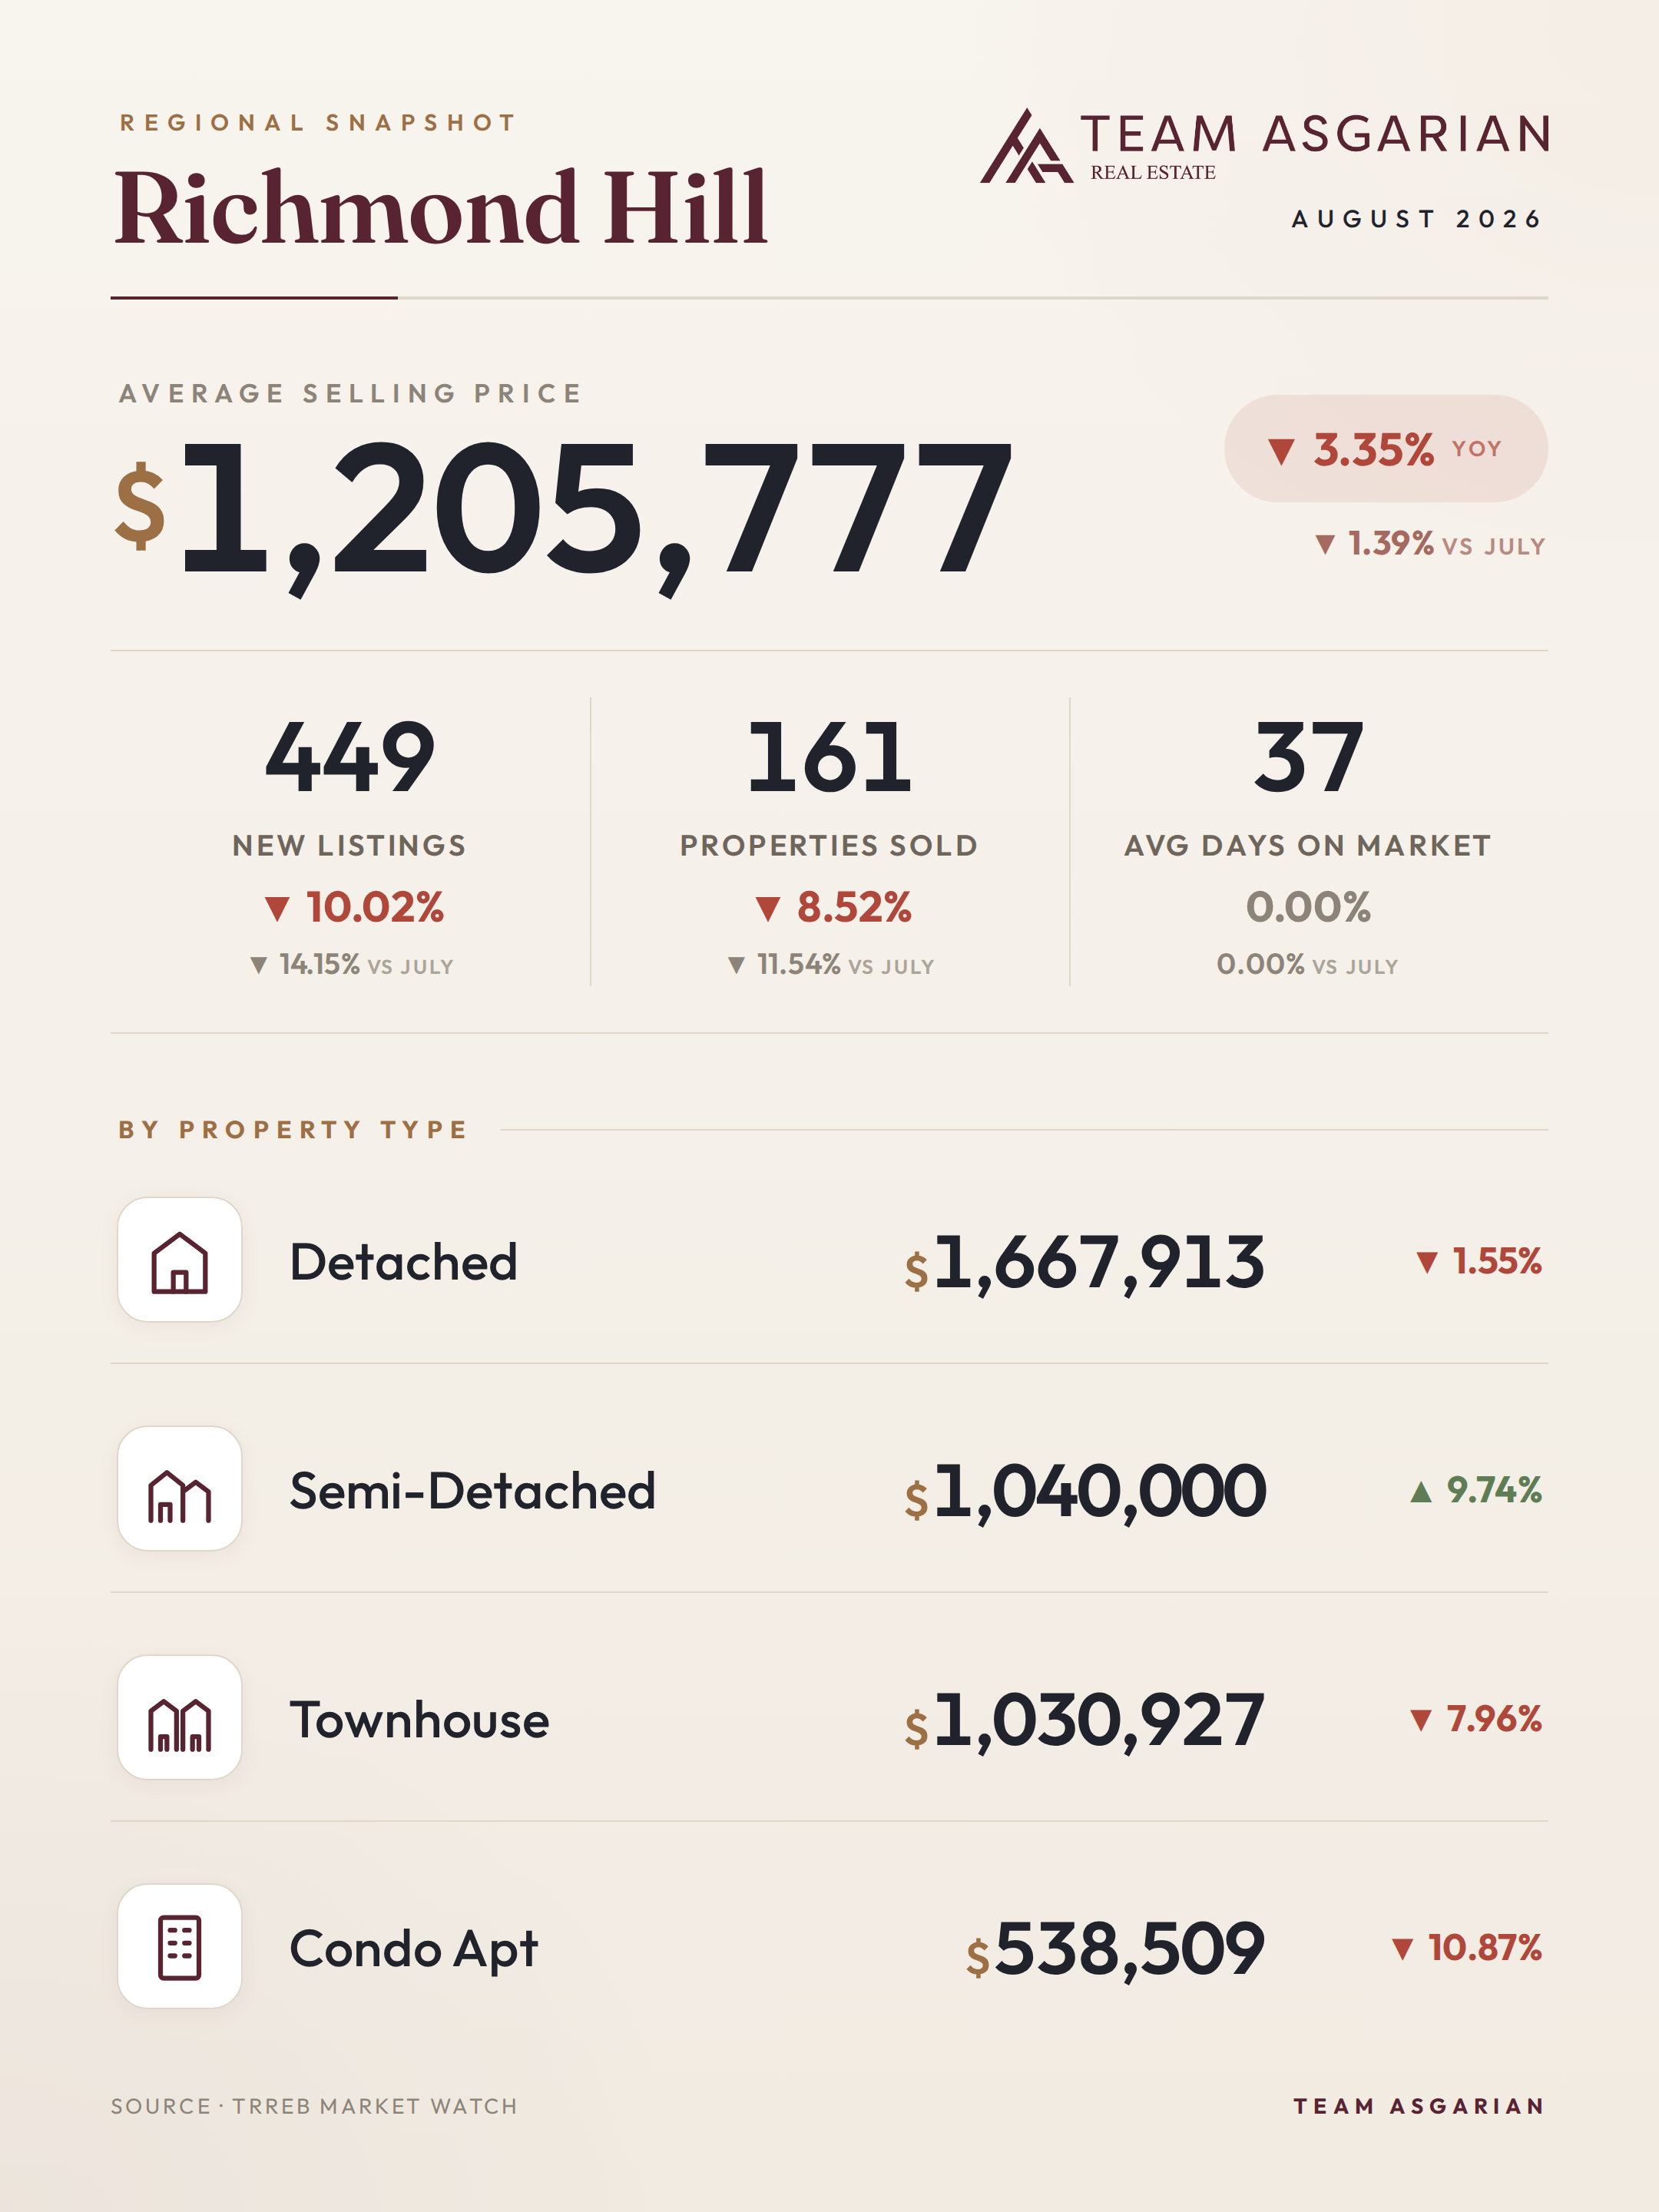
Richmond Hill did the opposite of Vaughan and Markham. Average price $1,205,777, down 3.35% year over year. Sales fell 8.52% to 161. New listings dropped 10.02% to 449, a sales-to-listings ratio near 36%, the softest here. Homes are taking 37 days to sell, flat against last year and slower than either neighbour.
Softness is opportunity when you're the one writing the offer. Detached at $1,667,913 is down 1.55% annually yet up 6.3% from July, so the floor is doing its job. Condo apartments at $538,509 fell 10.87%, the steepest condo correction in York Region and roughly $79,000 under the GTA condo average. Semi-detached ran the other direction at $1,040,000, up 9.74%. On 161 total sales, that's a thin sample and I wouldn't build a strategy on it. I've seen a number like that reverse itself the following month.
By the numbers for Richmond Hill, August 2026: average selling price $1,205,777 (-3.4% year-over-year); 161 homes sold (-8.5%); 449 new listings (-10.0%); 37 average days on market. By type: Detached $1,667,913 (-1.6% YoY, +6.3% vs prior month), Semi-Detached $1,040,000 (+9.7% YoY, -3.3% vs prior month), Townhouse $1,030,927 (-8.0% YoY, -1.1% vs prior month), Condo $538,509 (-10.9% YoY, -6.6% vs prior month).
Aurora's 18.69% drop is not what it looks like
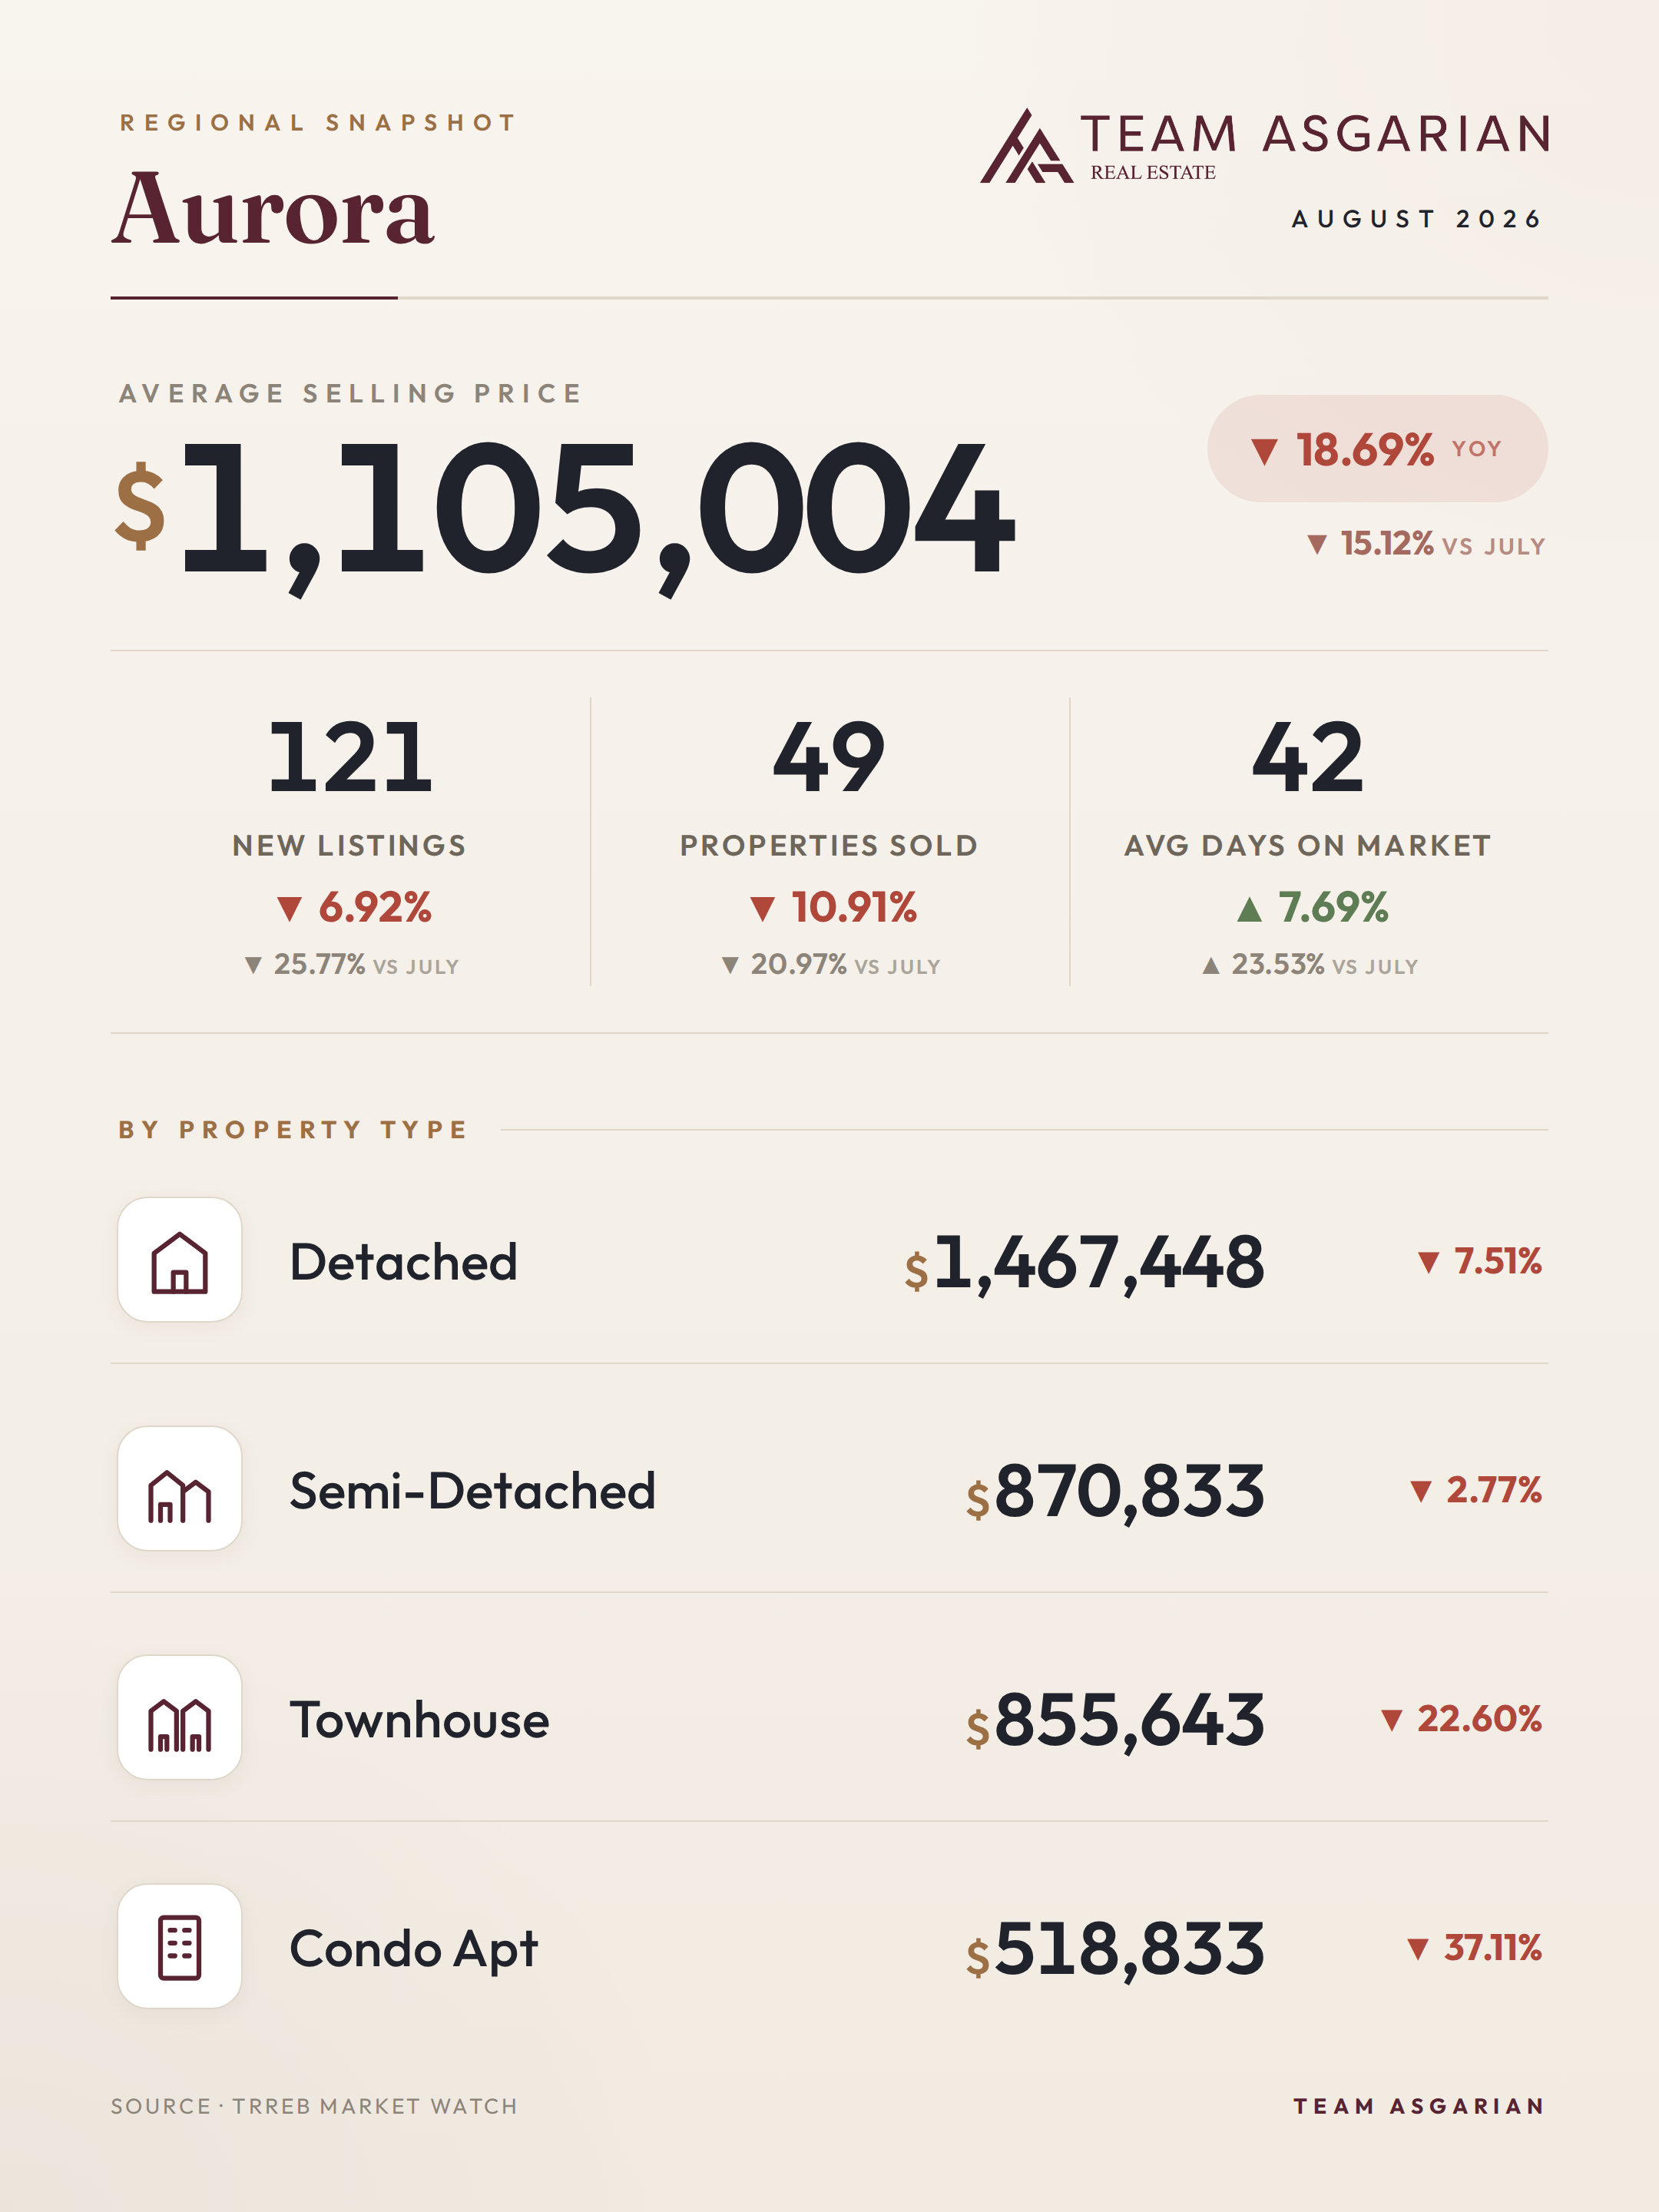
Aurora's average price of $1,105,004 is down 18.69% year over year and 15.12% from July. Before anyone panics or starts circling for a steal: 49 homes sold in Aurora in August. Forty-nine. At that volume, what sold moves the average far more than the market does.
Look at the types instead. Detached fell 7.51% to $1,467,448, a real decline and nowhere near 18%. Townhouses fell 22.6% to $855,643. Condo apartments fell 37.11% to $518,833, the lowest condo average in this report. When the cheap end of a small market takes a bigger share of the month's sales, the overall average falls faster than any single house lost value.

The soft signals are real, mind you. Days on market climbed to 42, the slowest here, up 23.53% from July. Sales fell 10.91% while new listings only fell 6.92%. Selling in Aurora this fall means pricing to what actually closed in the last 30 days and planning for a six-week runway. Buying, this is the market with the most negotiating room on the page.
By the numbers for Aurora, August 2026: average selling price $1,105,004 (-18.7% year-over-year); 49 homes sold (-10.9%); 121 new listings (-6.9%); 42 average days on market. By type: Detached $1,467,448 (-7.5% YoY, -10.6% vs prior month), Semi-Detached $870,833 (-2.8% YoY, -12.8% vs prior month), Townhouse $855,643 (-22.6% YoY, -9.6% vs prior month), Condo $518,833 (-37.1% YoY, -17.5% vs prior month).
Newmarket is the tightest market on this list
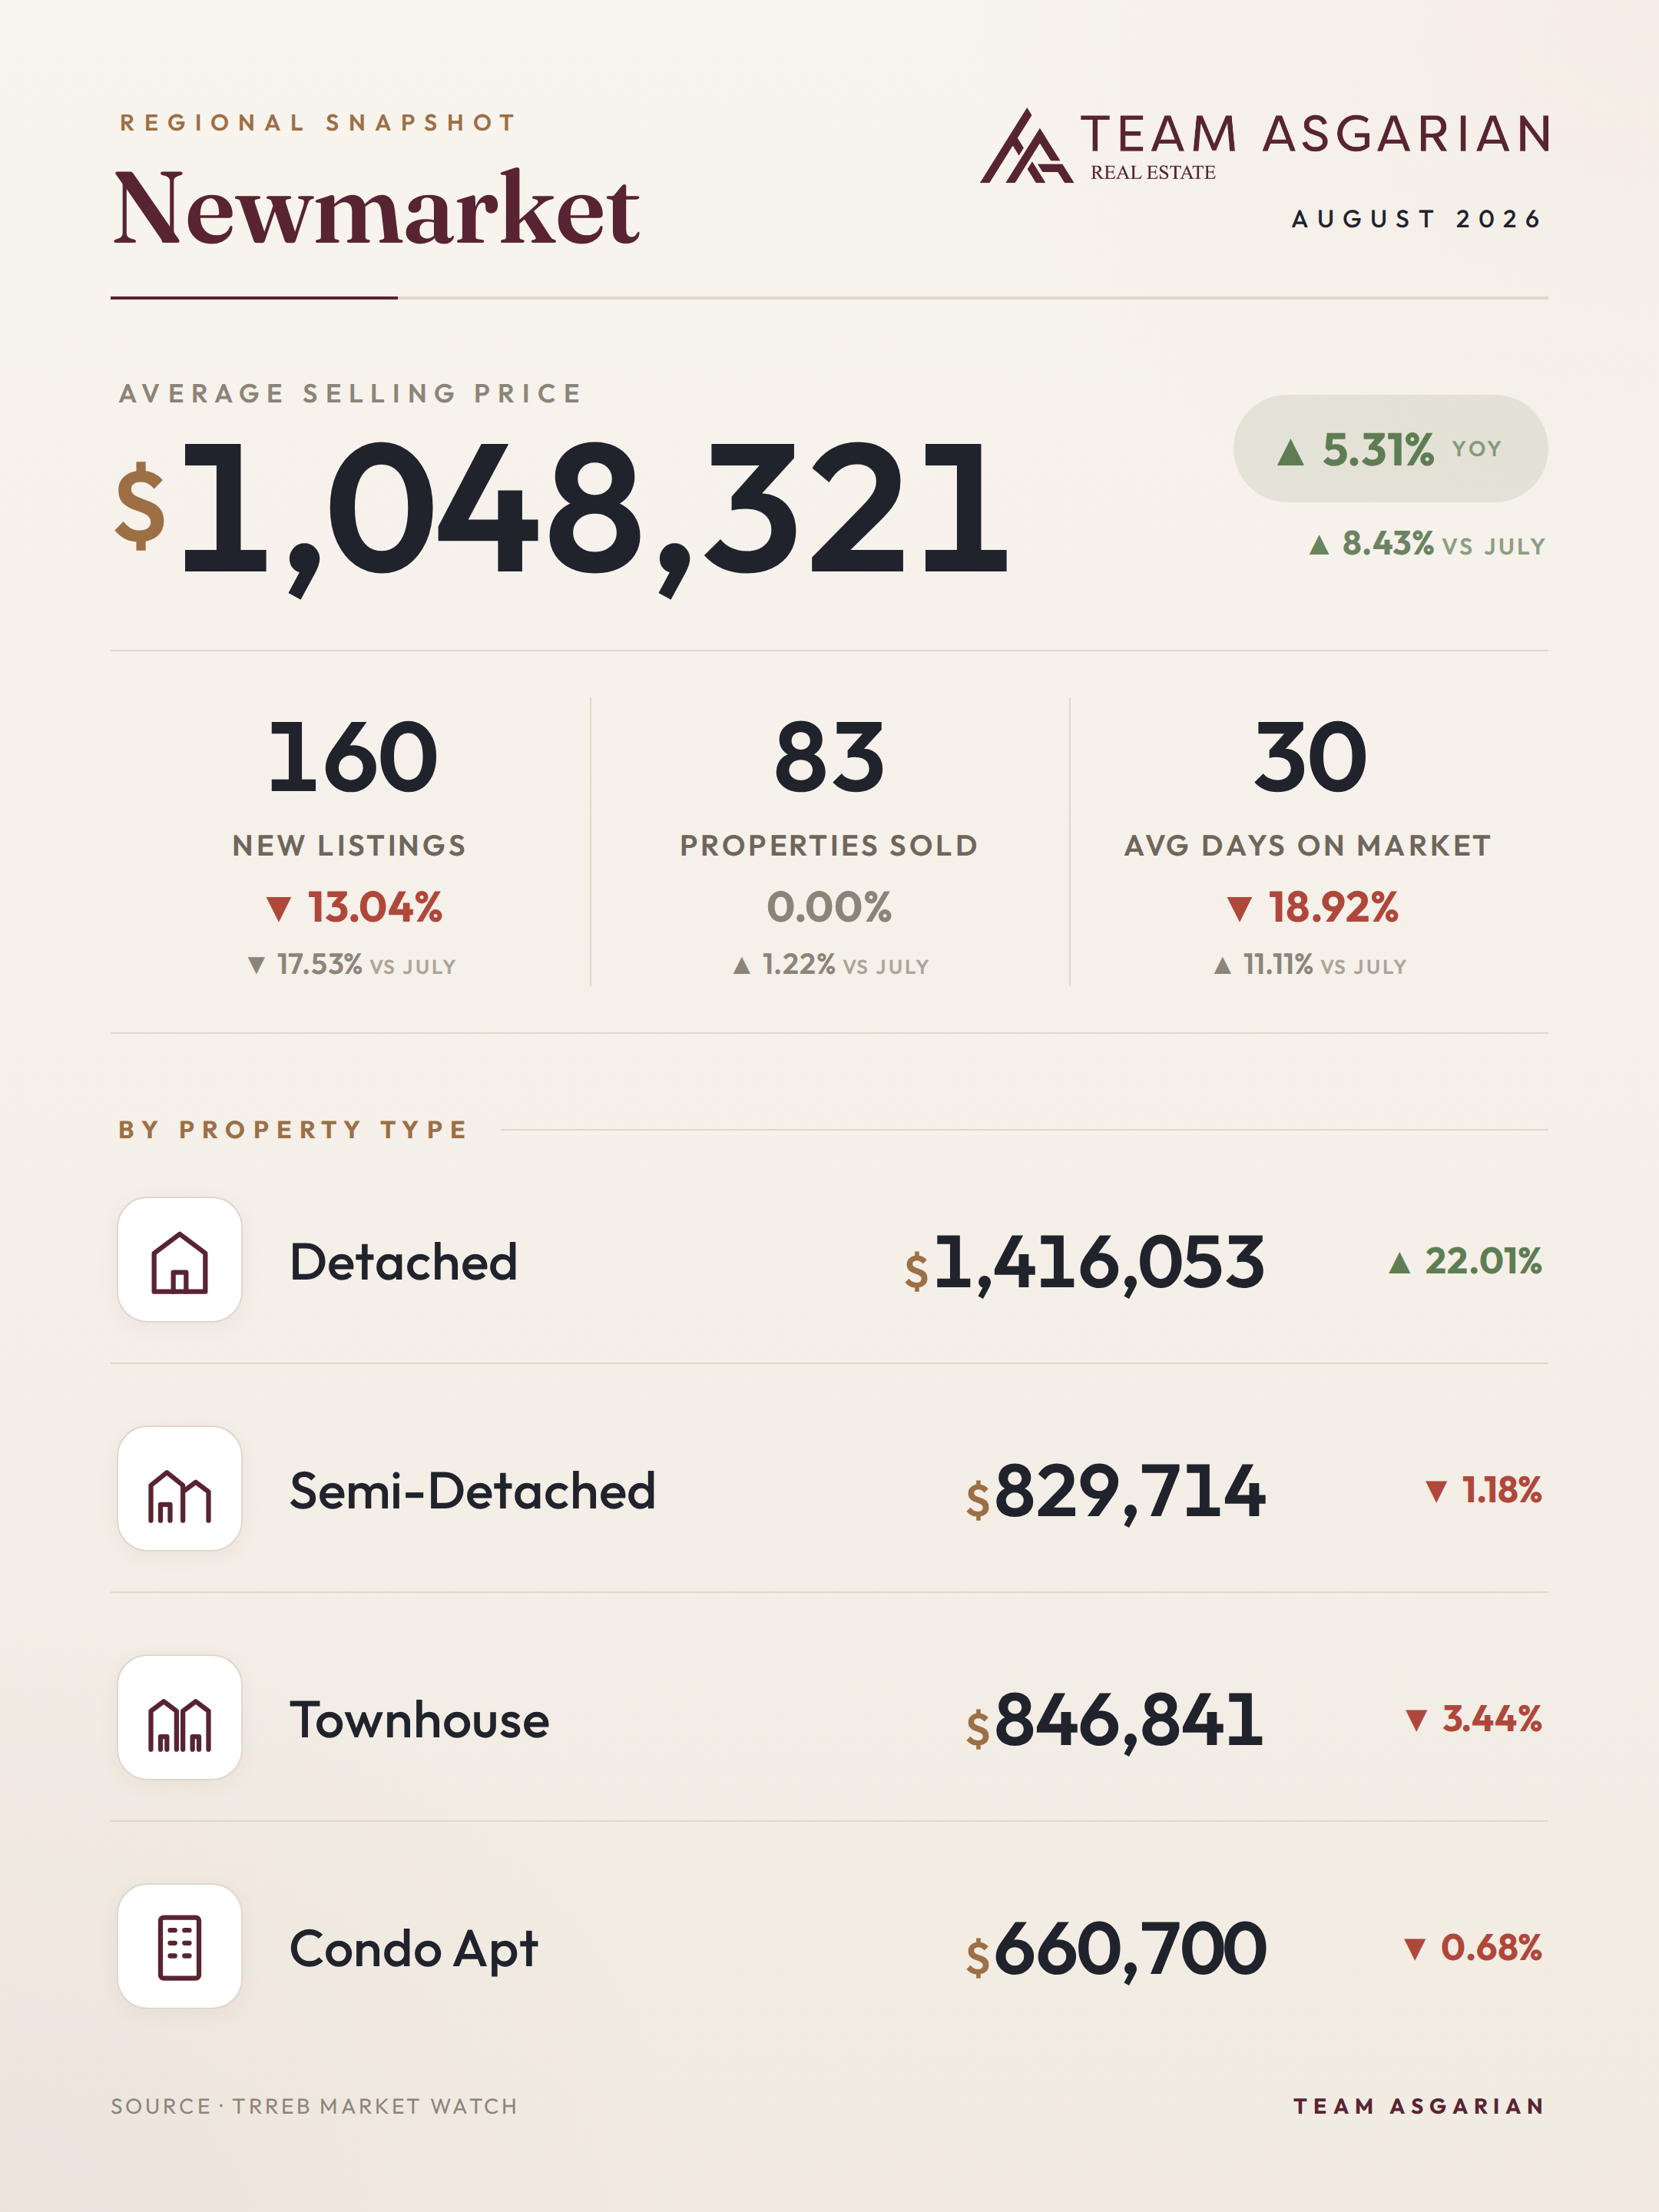
By the ratio that matters most, yes it is. Newmarket sold 83 homes against 160 new listings, about 52%, the highest in this report. It's also the only market where homes are selling faster than a year ago: 30 days on market, down 18.92%. The average price of $1,048,321 is up 5.31% year over year and 8.43% from July.
The pull is obvious once you line up the price tags. Detached averages $1,146,053 in Newmarket, against $1,467,448 in Aurora and over $1.6 million in Markham, Vaughan and Richmond Hill. That's a different mortgage payment, not a different lifestyle. Every property type here sits within 3.5% of where it was a year ago: detached -1.25%, semi -1.18%, town -3.44%, condo -0.68%. Steadiest set of numbers on this page. With new listings down 13.04%, though, don't plan on sleeping on it for a week.

By the numbers for Newmarket, August 2026: average selling price $1,048,321 (+5.3% year-over-year); 83 homes sold (+0.0%); 160 new listings (-13.0%); 30 average days on market. By type: Detached $1,146,053 (-1.3% YoY, +4.5% vs prior month), Semi-Detached $829,714 (-1.2% YoY, +7.8% vs prior month), Townhouse $846,841 (-3.4% YoY, +2.9% vs prior month), Condo $660,700 (-0.7% YoY, +29.0% vs prior month).
Frequently asked questions
Are GTA home prices going up or down right now?
Down. Gently. The August 2026 average was $993,410, which is 2.73% under August 2025 and 1.05% under July. It isn't uniform though, and that's what matters when you're pricing one specific house: townhouses are off 6.8%, semis 4.94%, detached only 1.8%. Three markets went the other way year over year. Markham up 6.37%, Newmarket up 5.31%, Vaughan up 1.97%.
Is now a good time to buy a condo in Toronto?
Best window I've seen in a while. Toronto condo apartments averaged $651,648 in August, down 2.4% on the year and 3.14% from July, with 4,200 new listings citywide against 1,767 total sales. Average days on market is 35. In plain terms, you get to see a unit twice, book an inspection, and write a conditional offer instead of guessing alongside eleven other people on a Tuesday night.
Why are there so few homes for sale in the GTA this month?
New listings fell 13.98% year over year to 12,075, and 16.63% from July on its own. Sellers who don't have to move are sitting on their hands until prices firm up. I've had that exact conversation four times this month. The odd result is a market that's tighter than last year even while prices soften: about 42% of new listings turned into a sale this August, versus roughly 37% last August.
Which GTA city had the strongest market in August 2026?
Markham and Newmarket, and it isn't close. Markham sold 282 homes, up 17.5% year over year, with the average price up 6.37% to $1,208,692. Newmarket sold 83 homes against only 160 new listings, about 52%, the tightest ratio in this report, and pulled average days on market down to 30, an 18.92% drop. It's the only market in the region where homes sold faster than they did last year.
Should I list my home this fall or wait until spring?
Depends what you own. Detached: your competition is thin right now, GTA new listings are down 13.98%, and detached values have barely moved at -1.8%. I'd list. Townhouse: down 6.8% GTA-wide, so waiting has a real argument behind it. Either way, price against what actually closed last month, not what your neighbour got in 2025. Average days on market is 35 and climbing 6.06% year over year, and the overpriced listings are the ones dragging that number up.