
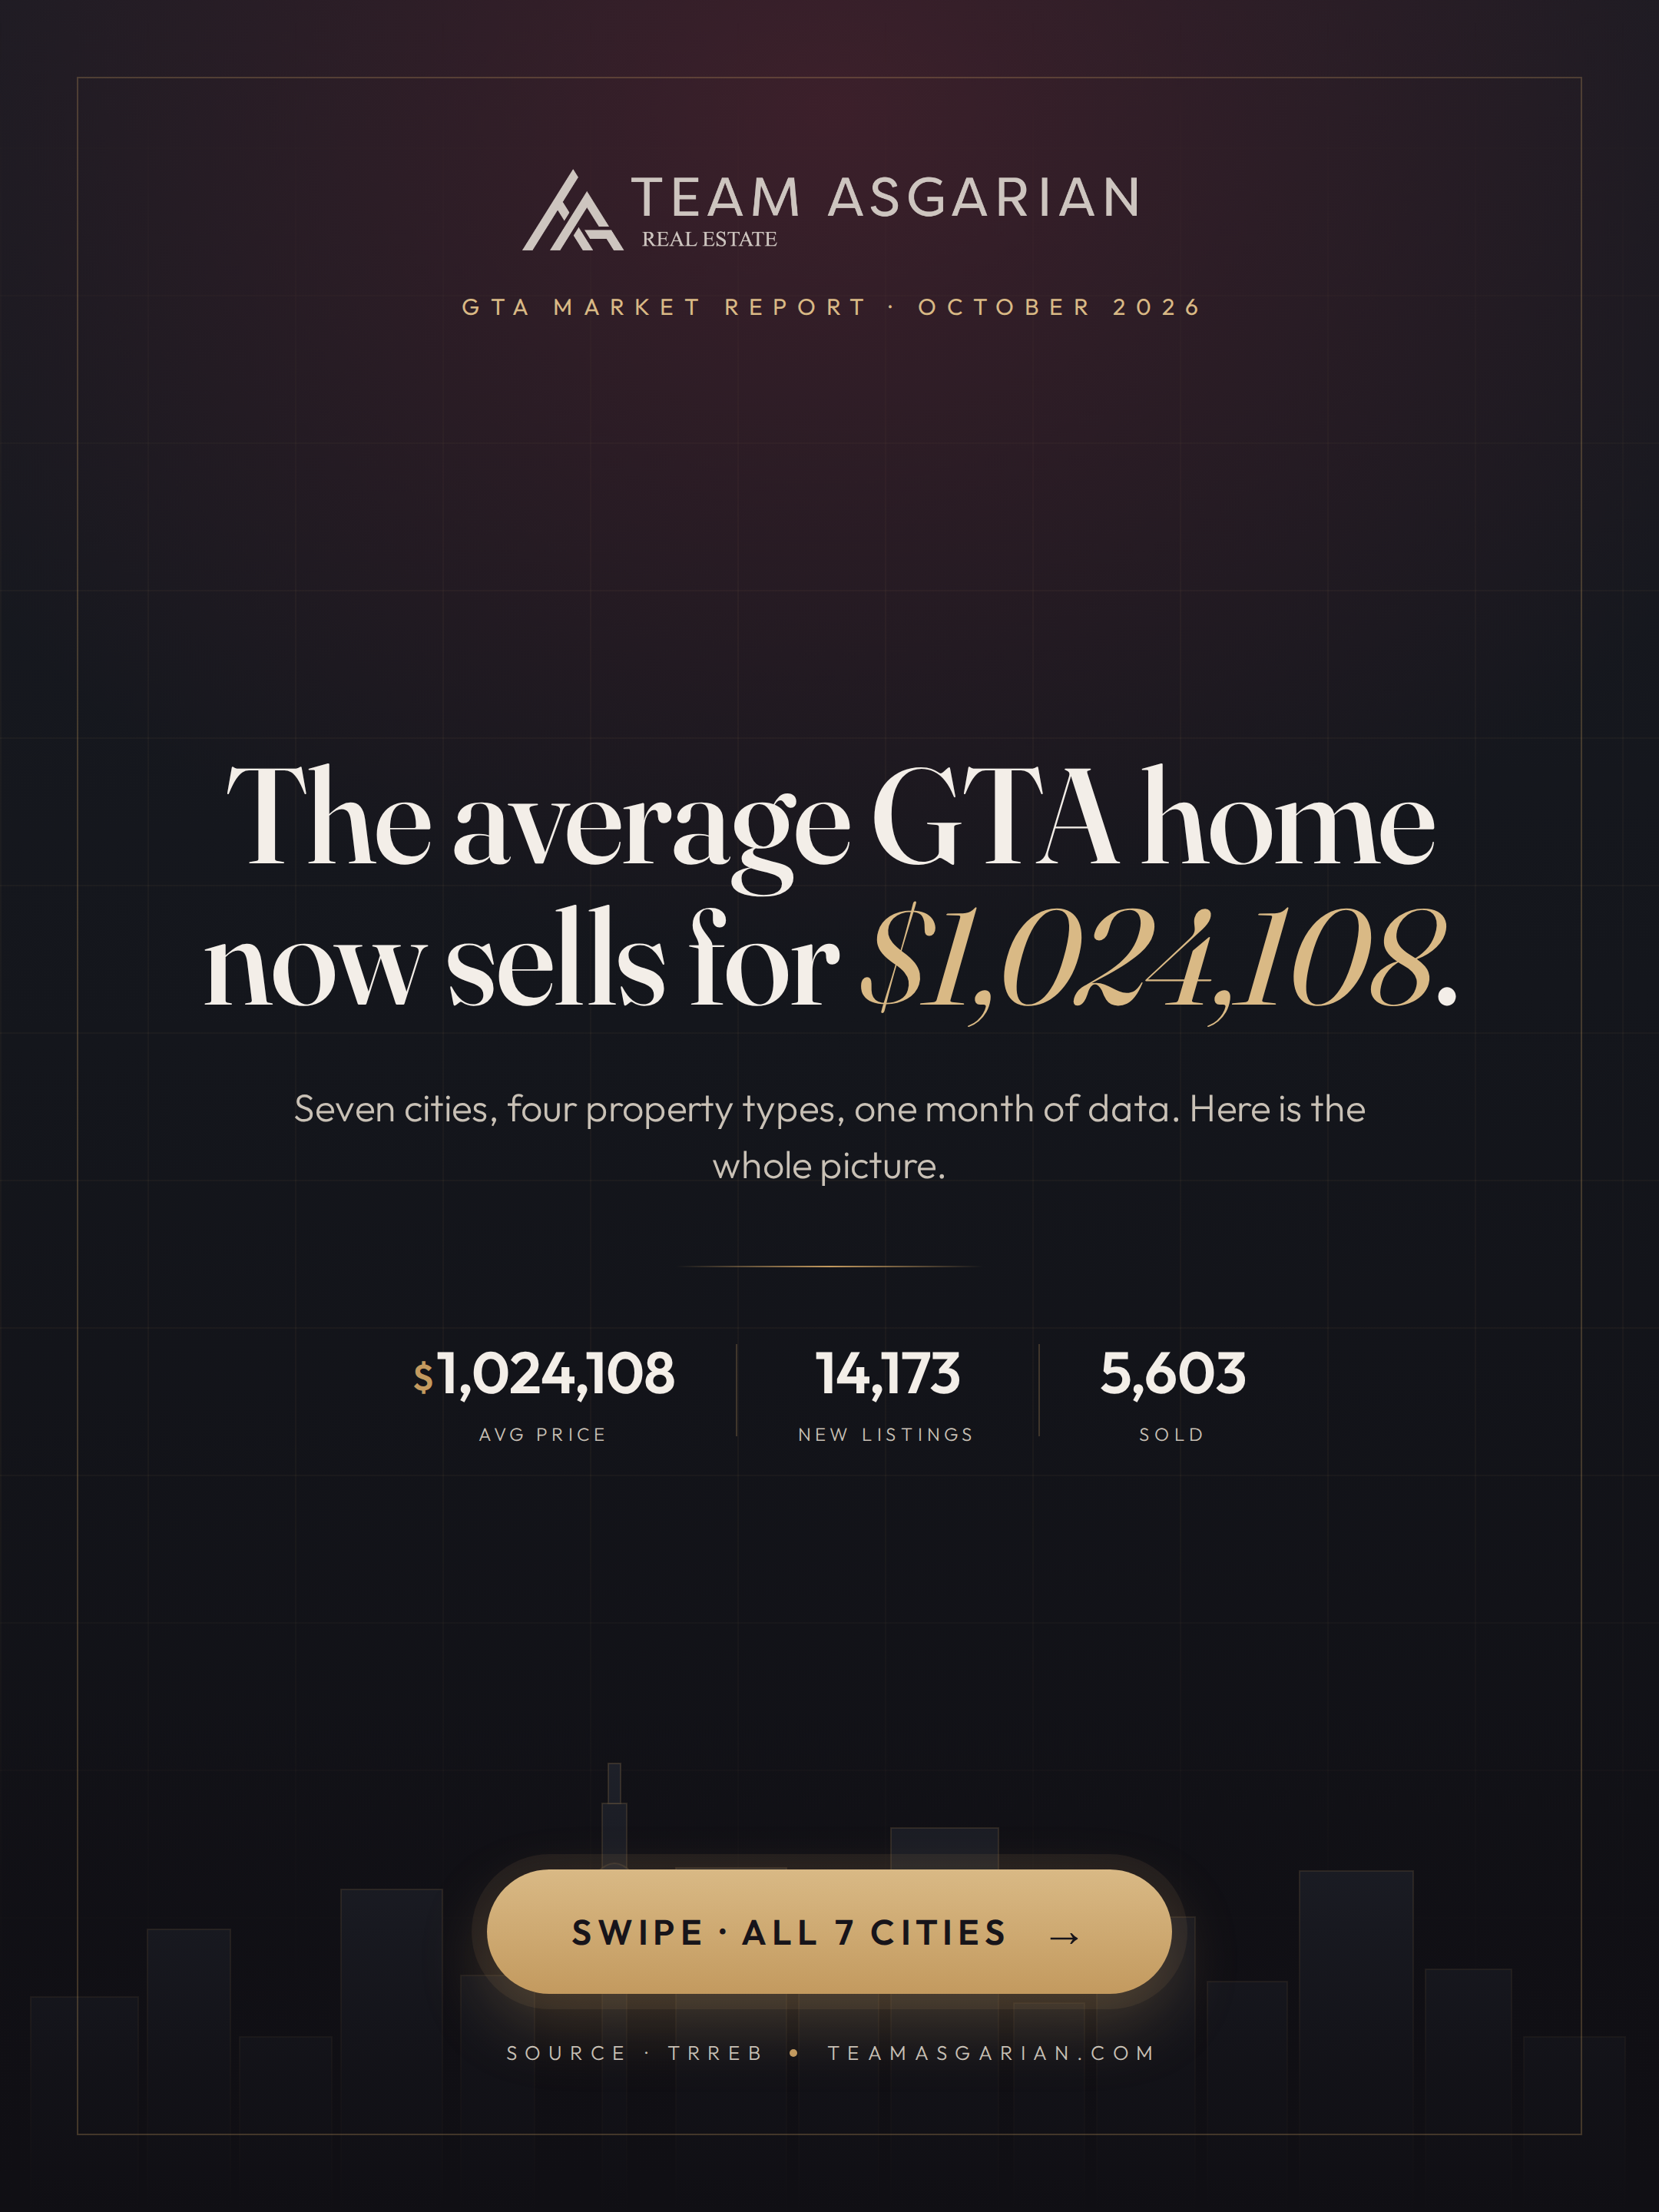
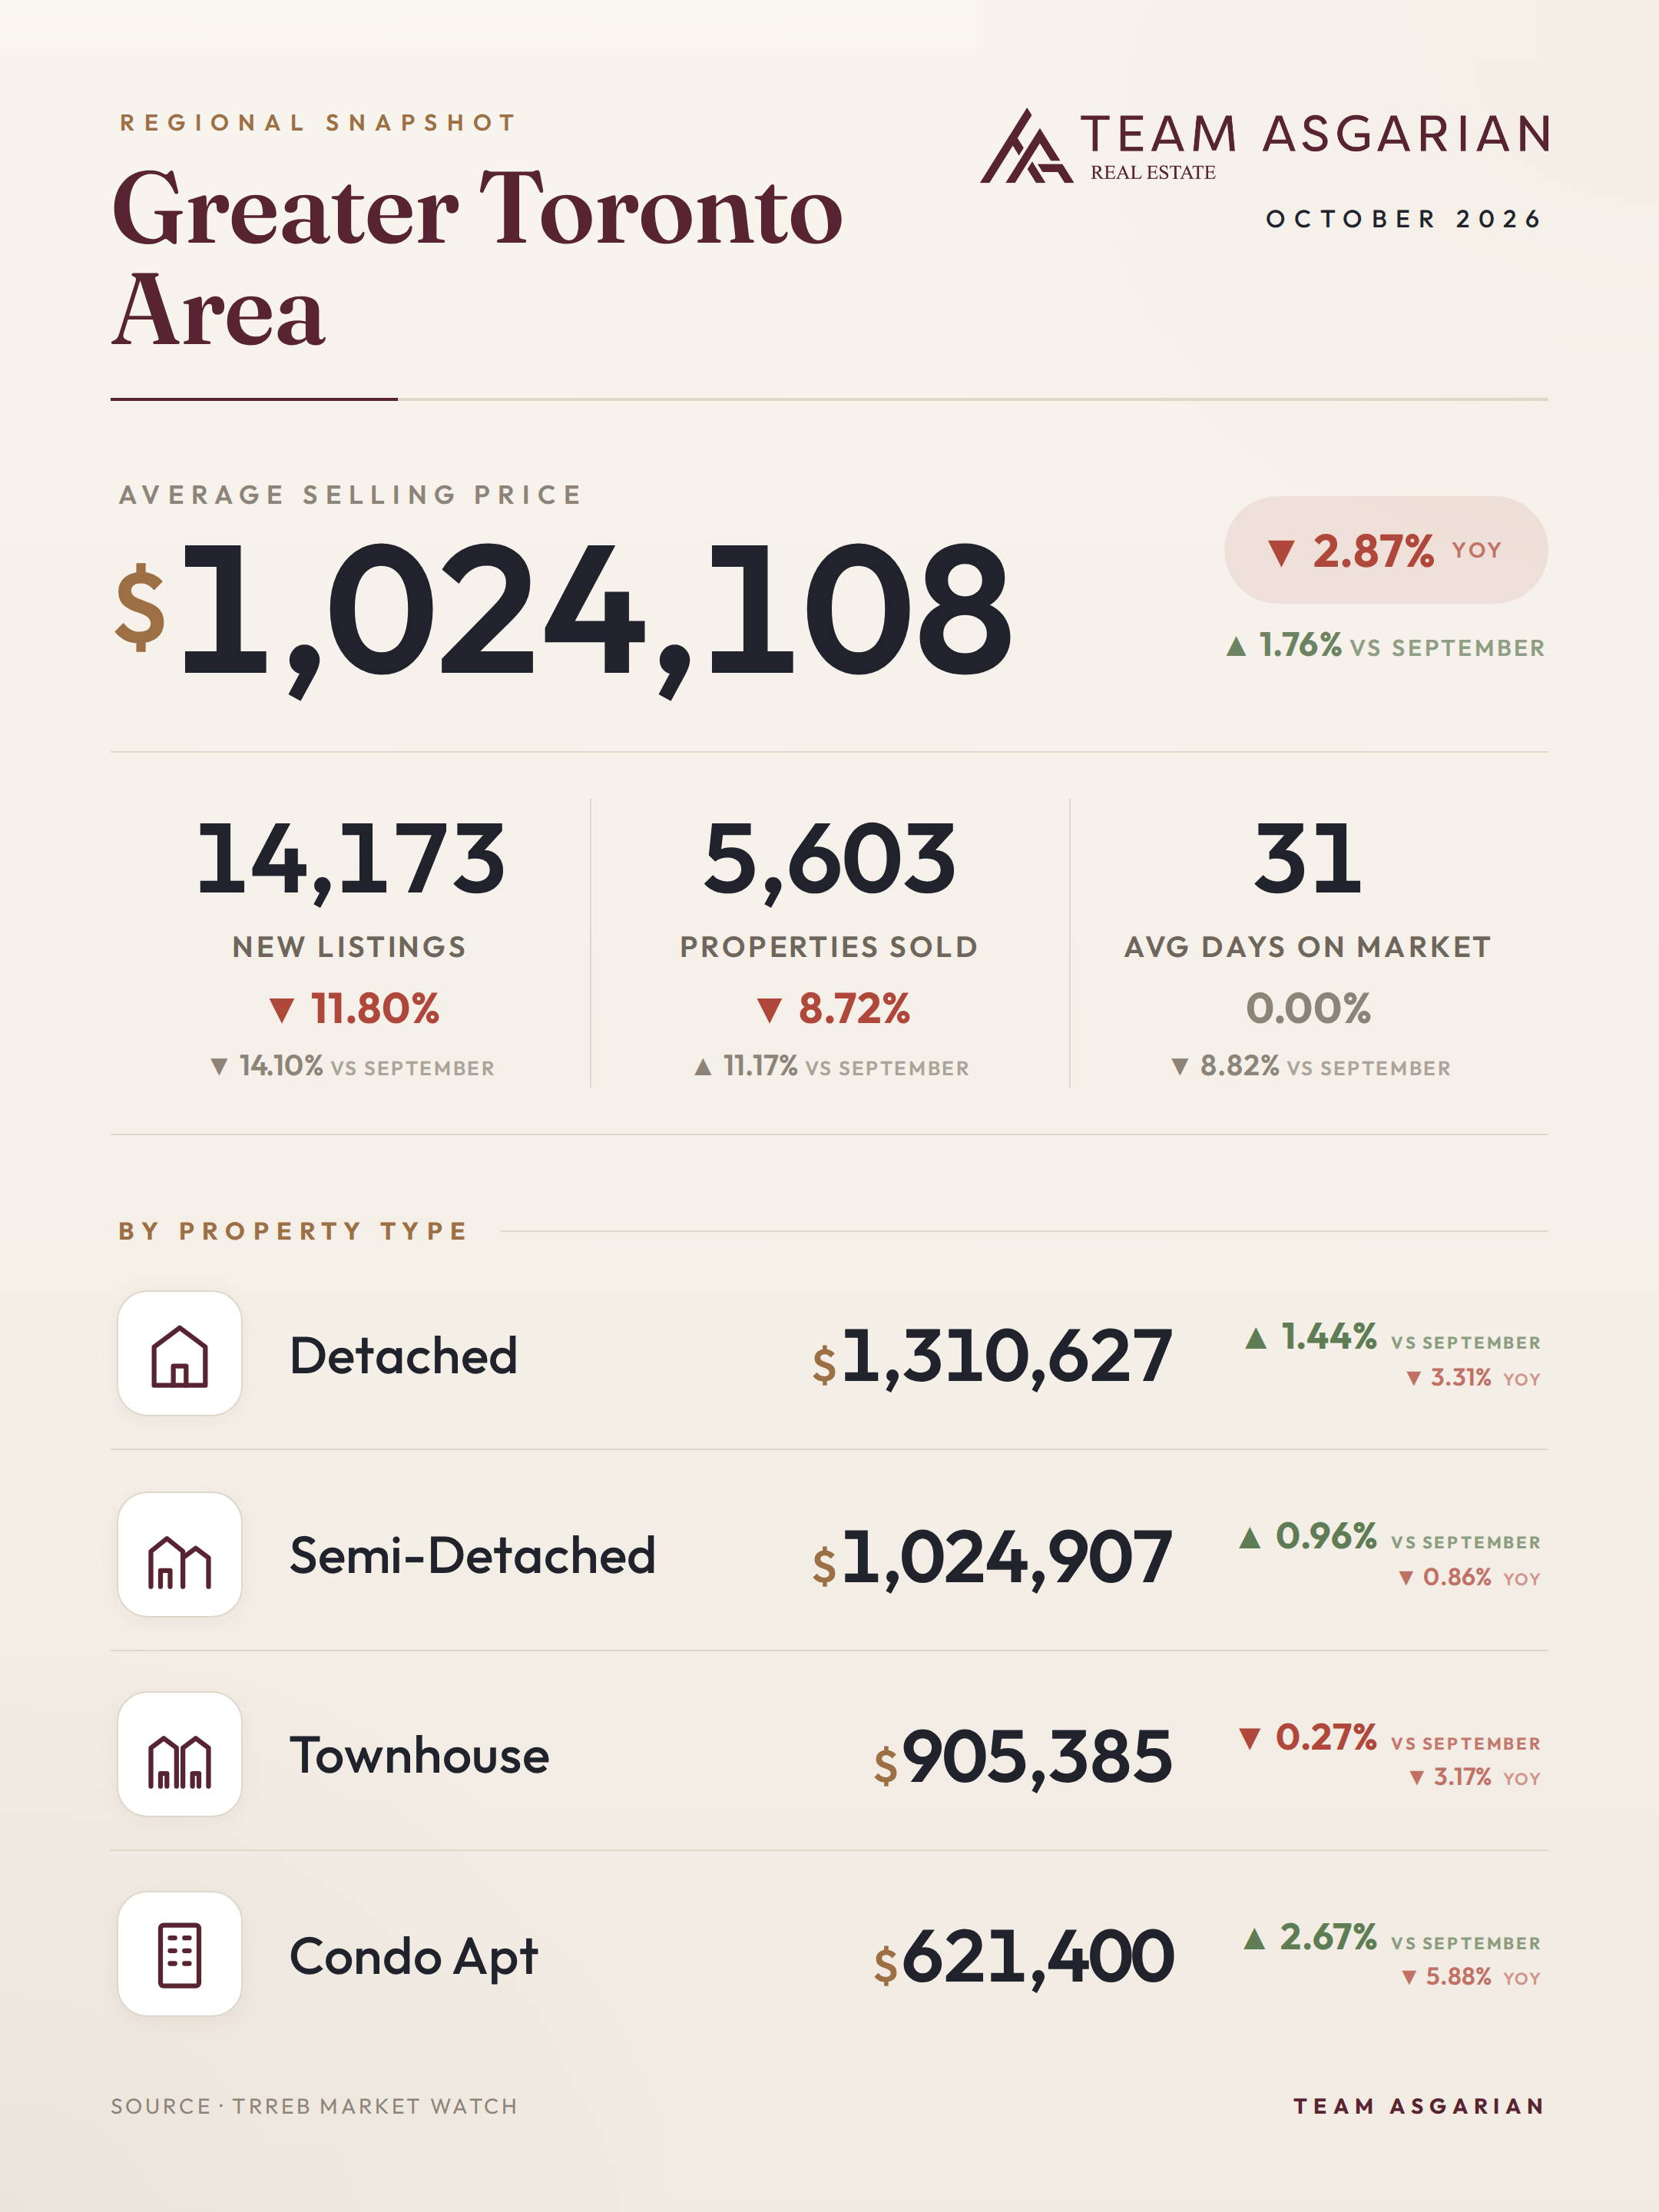
October tends to tell you how the fall market really feels. This year it felt steadier. 5,603 homes sold across the Greater Toronto Area in October 2026, up 11.17% from September. New listings dropped 14.1% to 14,173. The average selling price rose 1.76% month over month to $1,024,108. Against last October, though, prices are still 2.87% lower and sales are down 8.72%. Firmer month. Not a turnaround.
Zoom out and it gets more interesting. In October 2016 the GTA average was $762,975, and today's price is 34.23% higher. In October 2021 it was $1,155,345, and we're now 11.36% below that. Sales tell a different story. 9,783 homes sold in October 2021 and 9,768 in October 2016, so this October came in about 42% lower than both. If you bought ten years ago, you probably have real equity sitting in your walls. If you're buying now, you're up against far less competition than in the bidding-war years, back when clients routinely lost house after house to bully offers. None of this tells you where prices go next. It tells you where we're standing.
Average days on market: 31. Same as a year ago, and down from about 34 in September. Roughly four homes sold for every ten new listings. Buyers still have choice. The market's tightening anyway. City by city, here's how it shook out.
Which GTA home types are holding value, and which are soft?
Semis held up best. They averaged $1,024,907, down just 0.86% from last October. Detached homes averaged $1,310,627, down 3.31% on the year but up 1.44% from September. Townhouses came in at $905,385, down 3.17%, and they were the only type whose average slipped from September (by 0.27%). Condo apartments were weakest at $621,400, down 5.88% from a year ago, though up 2.67% month over month.
So if you're buying, condos are where prices have come down most. That's good news for first-time buyers and for downsizers leaving a bigger house. Townhouse prices have barely budged, so expect a fair deal, not a steal. Selling? Semi owners hold the best hand right now. Condo sellers need to price against what sold in the last few weeks, not last year. Buyers read the same headlines you do. They'll negotiate.
By the numbers for Greater Toronto Area, October 2026: average selling price $1,024,108 (-2.9% year-over-year); 5,603 homes sold (-8.7%); 14,173 new listings (-11.8%); 31 average days on market. By type: Detached $1,310,627 (-3.3% YoY, +1.4% vs prior month), Semi-Detached $1,024,907 (-0.9% YoY, +1.0% vs prior month), Townhouse $905,385 (-3.2% YoY, -0.3% vs prior month), Condo $621,400 (-5.9% YoY, +2.7% vs prior month). Five years ago (October 2021) the average was $1,155,345: today's is 11.4% lower, with 42.7% fewer sales; ten years ago (October 2016) the average was $762,975: today's is 34.2% higher, with 42.6% fewer sales.
Why is the City of Toronto the only market with rising prices?
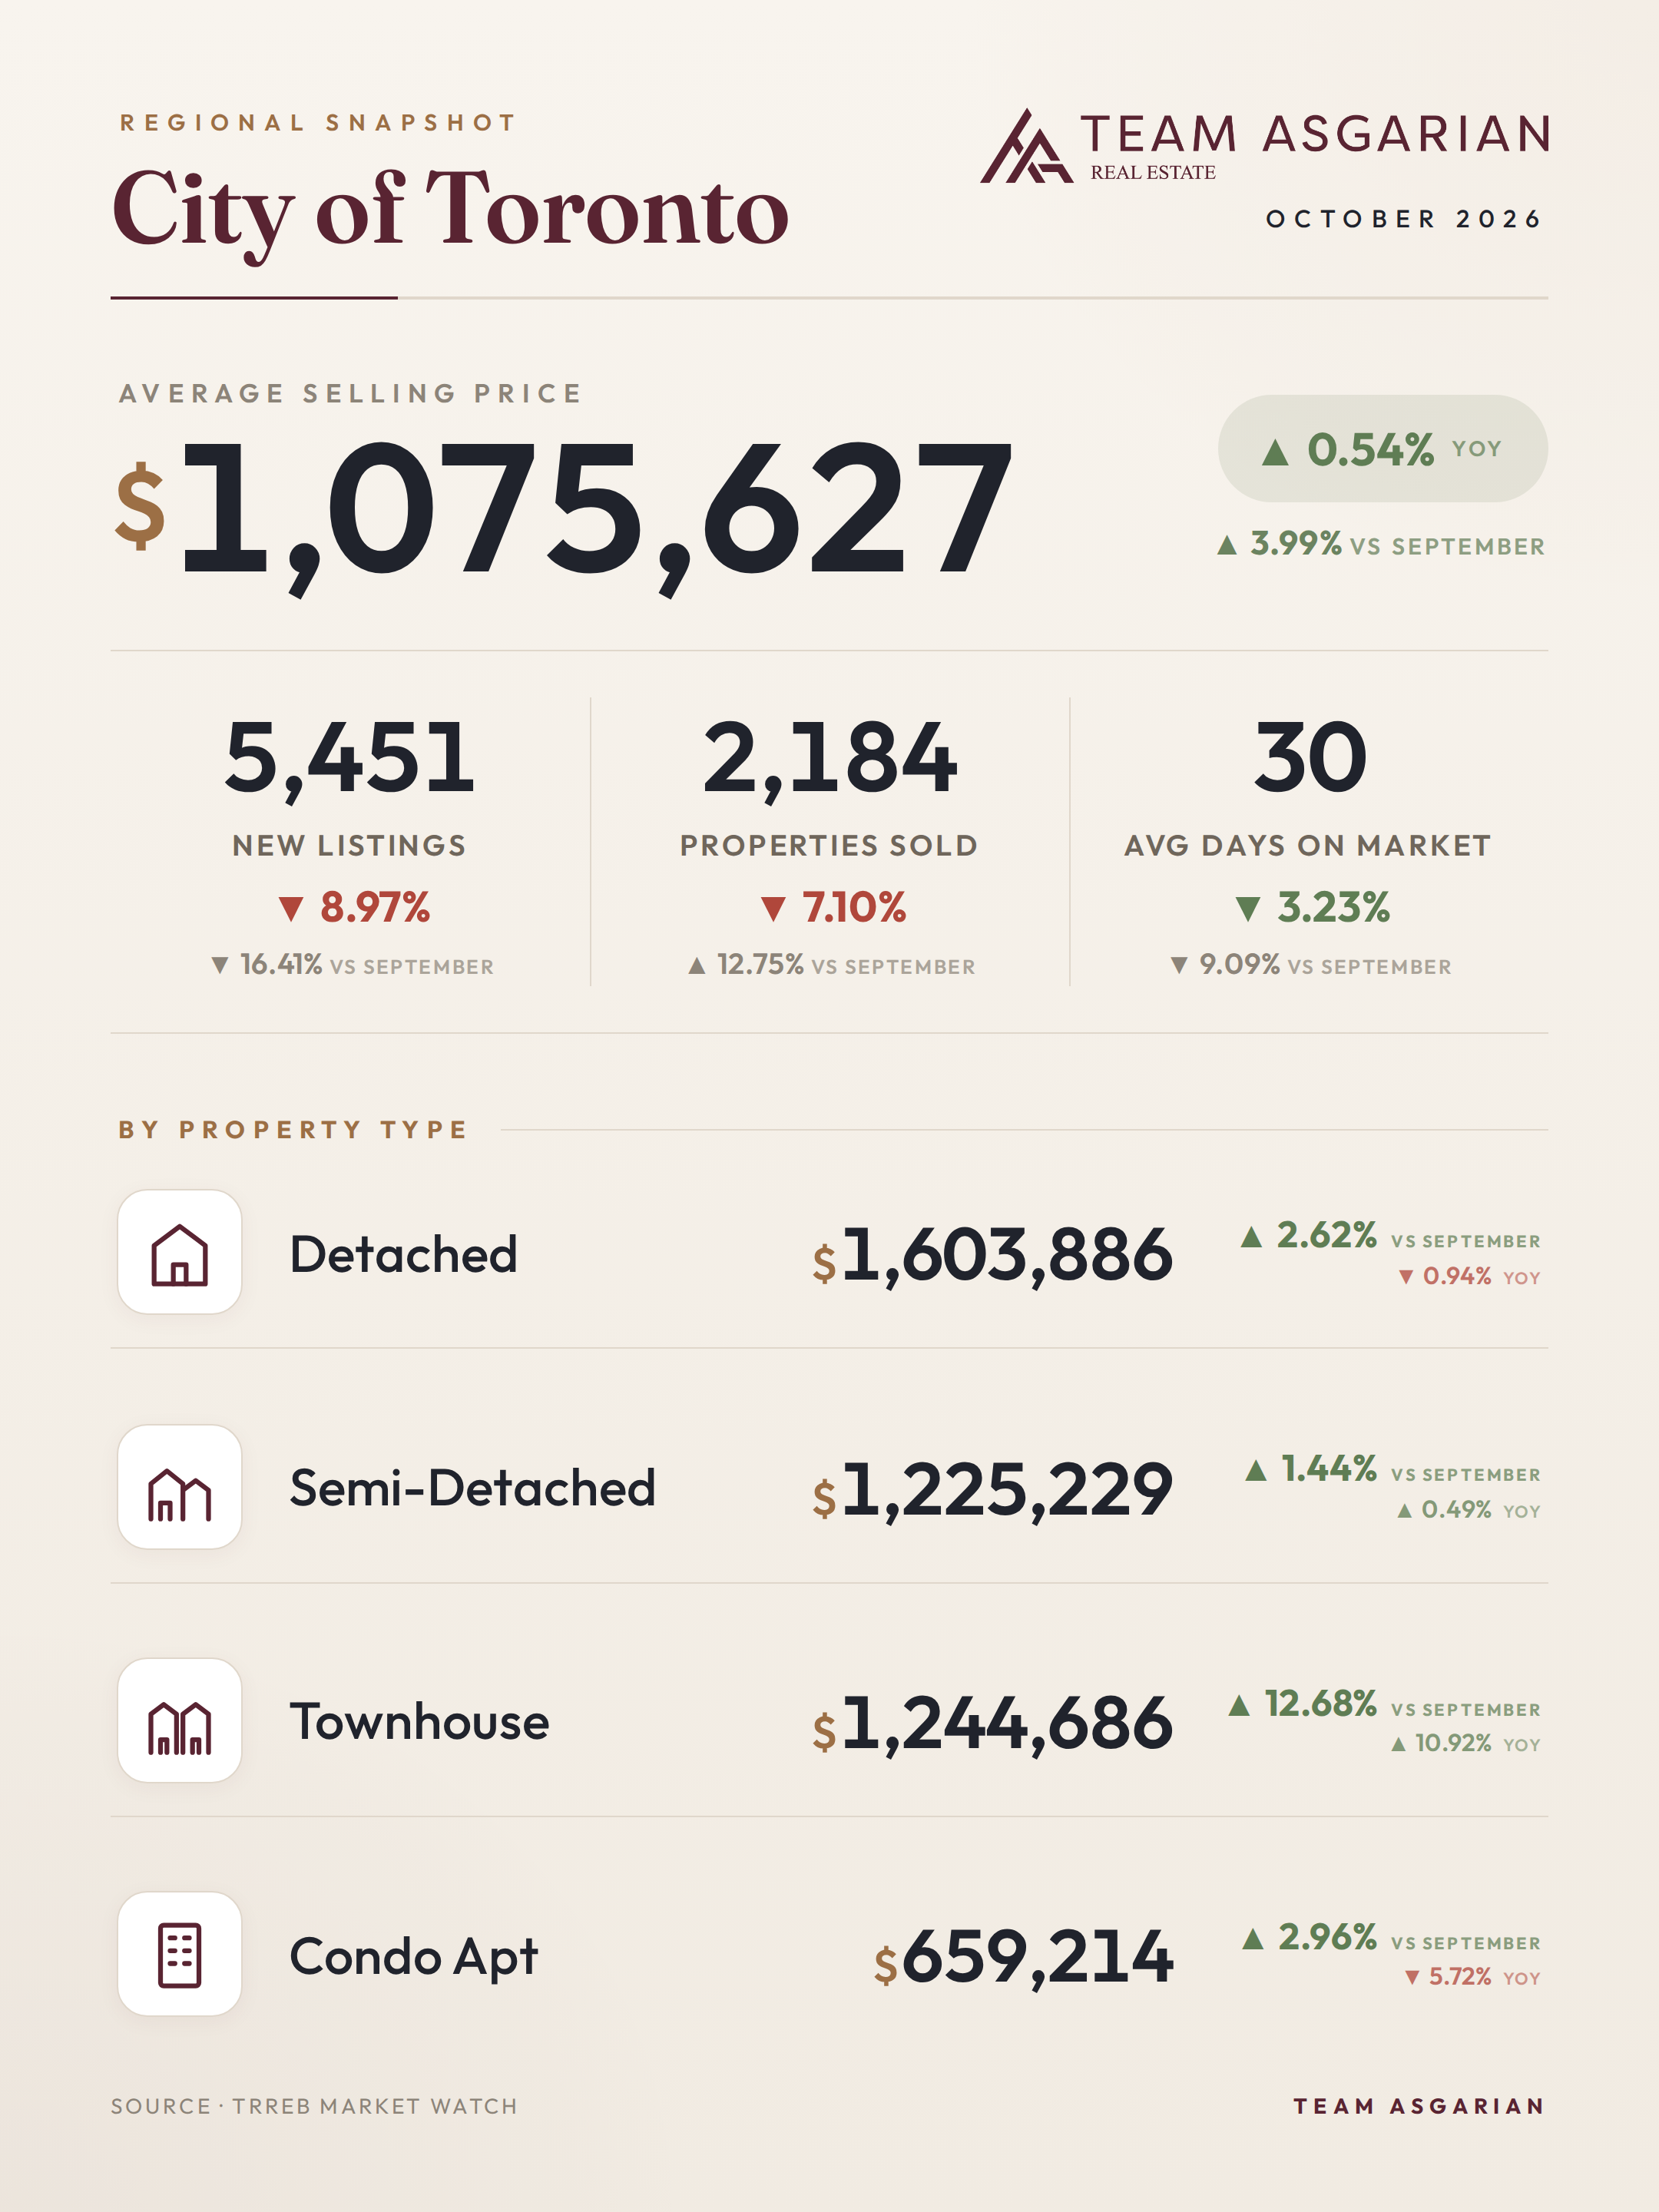
Toronto was the only region we track where prices beat last year. The average was $1,075,627, up 0.54% year over year and 3.99% from September. 2,184 homes sold, down 7.1% from last October but up 12.75% from September. Meanwhile new listings fell 16.41% month over month to 5,451, and homes sold in 30 days on average. More buyers, fewer fresh listings. That's what pushed the average up.
Detached homes averaged $1,603,886 (down 0.94%), semis $1,225,229 (up 0.49%) and condo apartments $659,214 (down 5.72%). Townhouses jumped 10.92% to $1,244,686, which put them above semis. Don't get excited. That mostly tells you which townhouses happened to sell this month. It doesn't mean every townhouse in the city gained 11%, so please don't price yours off that number.
Over time, Toronto has held value best too. Prices are only 4.17% below October 2021 ($1,122,463), the smallest drop of any region here, and 39.6% above October 2016 ($770,480), the biggest ten-year gain. For buyers, that means fewer discounts than out in the 905 suburbs. Condos are the exception. For sellers, Toronto is the steadiest ground in the region.
By the numbers for City of Toronto, October 2026: average selling price $1,075,627 (+0.5% year-over-year); 2,184 homes sold (-7.1%); 5,451 new listings (-9.0%); 30 average days on market. By type: Detached $1,603,886 (-0.9% YoY, +2.6% vs prior month), Semi-Detached $1,225,229 (+0.5% YoY, +1.4% vs prior month), Townhouse $1,244,686 (+10.9% YoY, +12.7% vs prior month), Condo $659,214 (-5.7% YoY, +3.0% vs prior month). Five years ago (October 2021) the average was $1,122,463: today's is 4.2% lower, with 42.4% fewer sales; ten years ago (October 2016) the average was $770,480: today's is 39.6% higher, with 41.2% fewer sales.
Is Vaughan a buyer's market or a seller's market right now?
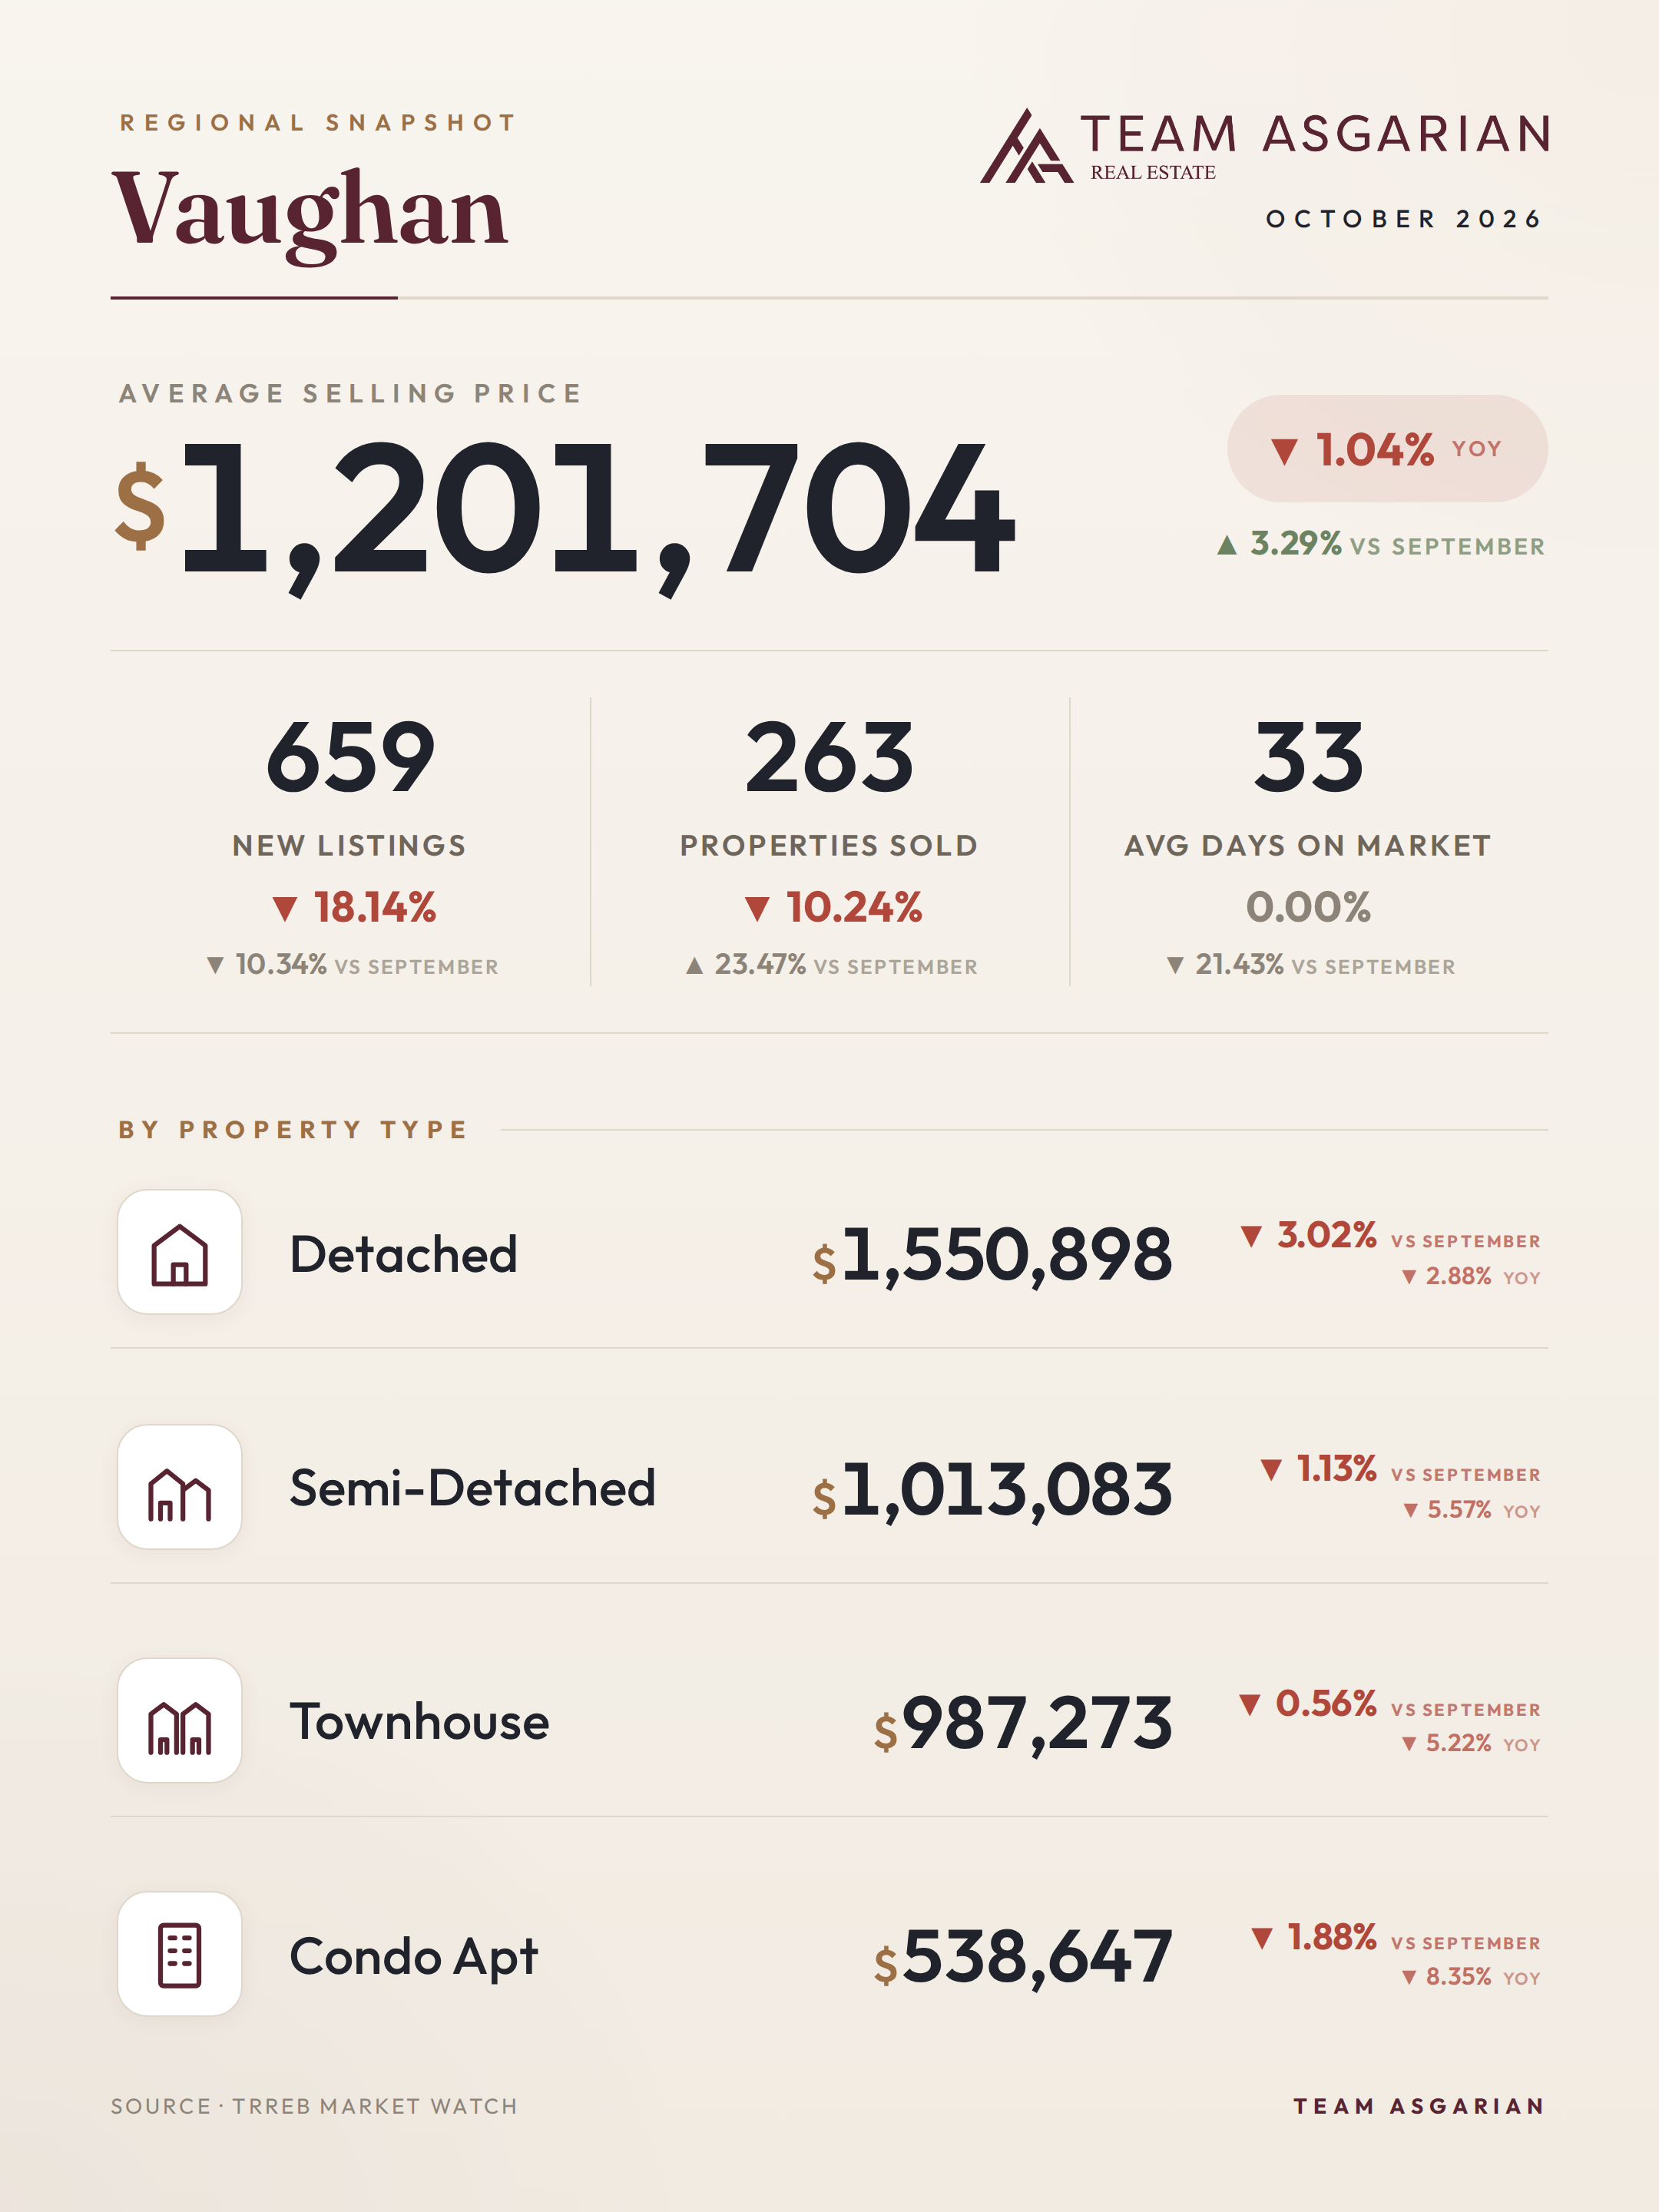
Close to balanced, and getting busier. The average price was $1,201,704, down 1.04% from a year ago and up 3.29% from September. 263 homes sold, up 23.47% month over month, and average days on market dropped from about 42 to 33. New listings were 659, down 18.14% from last October. Only Aurora saw a bigger drop.
Now the part most people skim past. All four home types fell from a year ago, and all four fell from September too. Detached averaged $1,550,898 (down 2.88% for the year and 3.02% for the month), semis $1,013,083 (down 5.57%), townhouses $987,273 (down 5.22%) and condos $538,647 (down 8.35%). The overall average rose only because more of what sold was higher-priced. Individual homes didn't gain value. This is exactly why I tell people to stop staring at the headline average.
Vaughan prices are 11.73% below October 2021 ($1,361,443) and 25.16% above October 2016 ($960,146). Buyers can still negotiate on every home type. Sellers are seeing more buyers, sure. Price off recent sales of homes like yours, though, not the overall average.
By the numbers for Vaughan, October 2026: average selling price $1,201,704 (-1.0% year-over-year); 263 homes sold (-10.2%); 659 new listings (-18.1%); 33 average days on market. By type: Detached $1,550,898 (-2.9% YoY, -3.0% vs prior month), Semi-Detached $1,013,083 (-5.6% YoY, -1.1% vs prior month), Townhouse $987,273 (-5.2% YoY, -0.6% vs prior month), Condo $538,647 (-8.3% YoY, -1.9% vs prior month). Five years ago (October 2021) the average was $1,361,443: today's is 11.7% lower, with 41.8% fewer sales; ten years ago (October 2016) the average was $960,146: today's is 25.2% higher, with 34.1% fewer sales.
What's going on with Markham home prices?
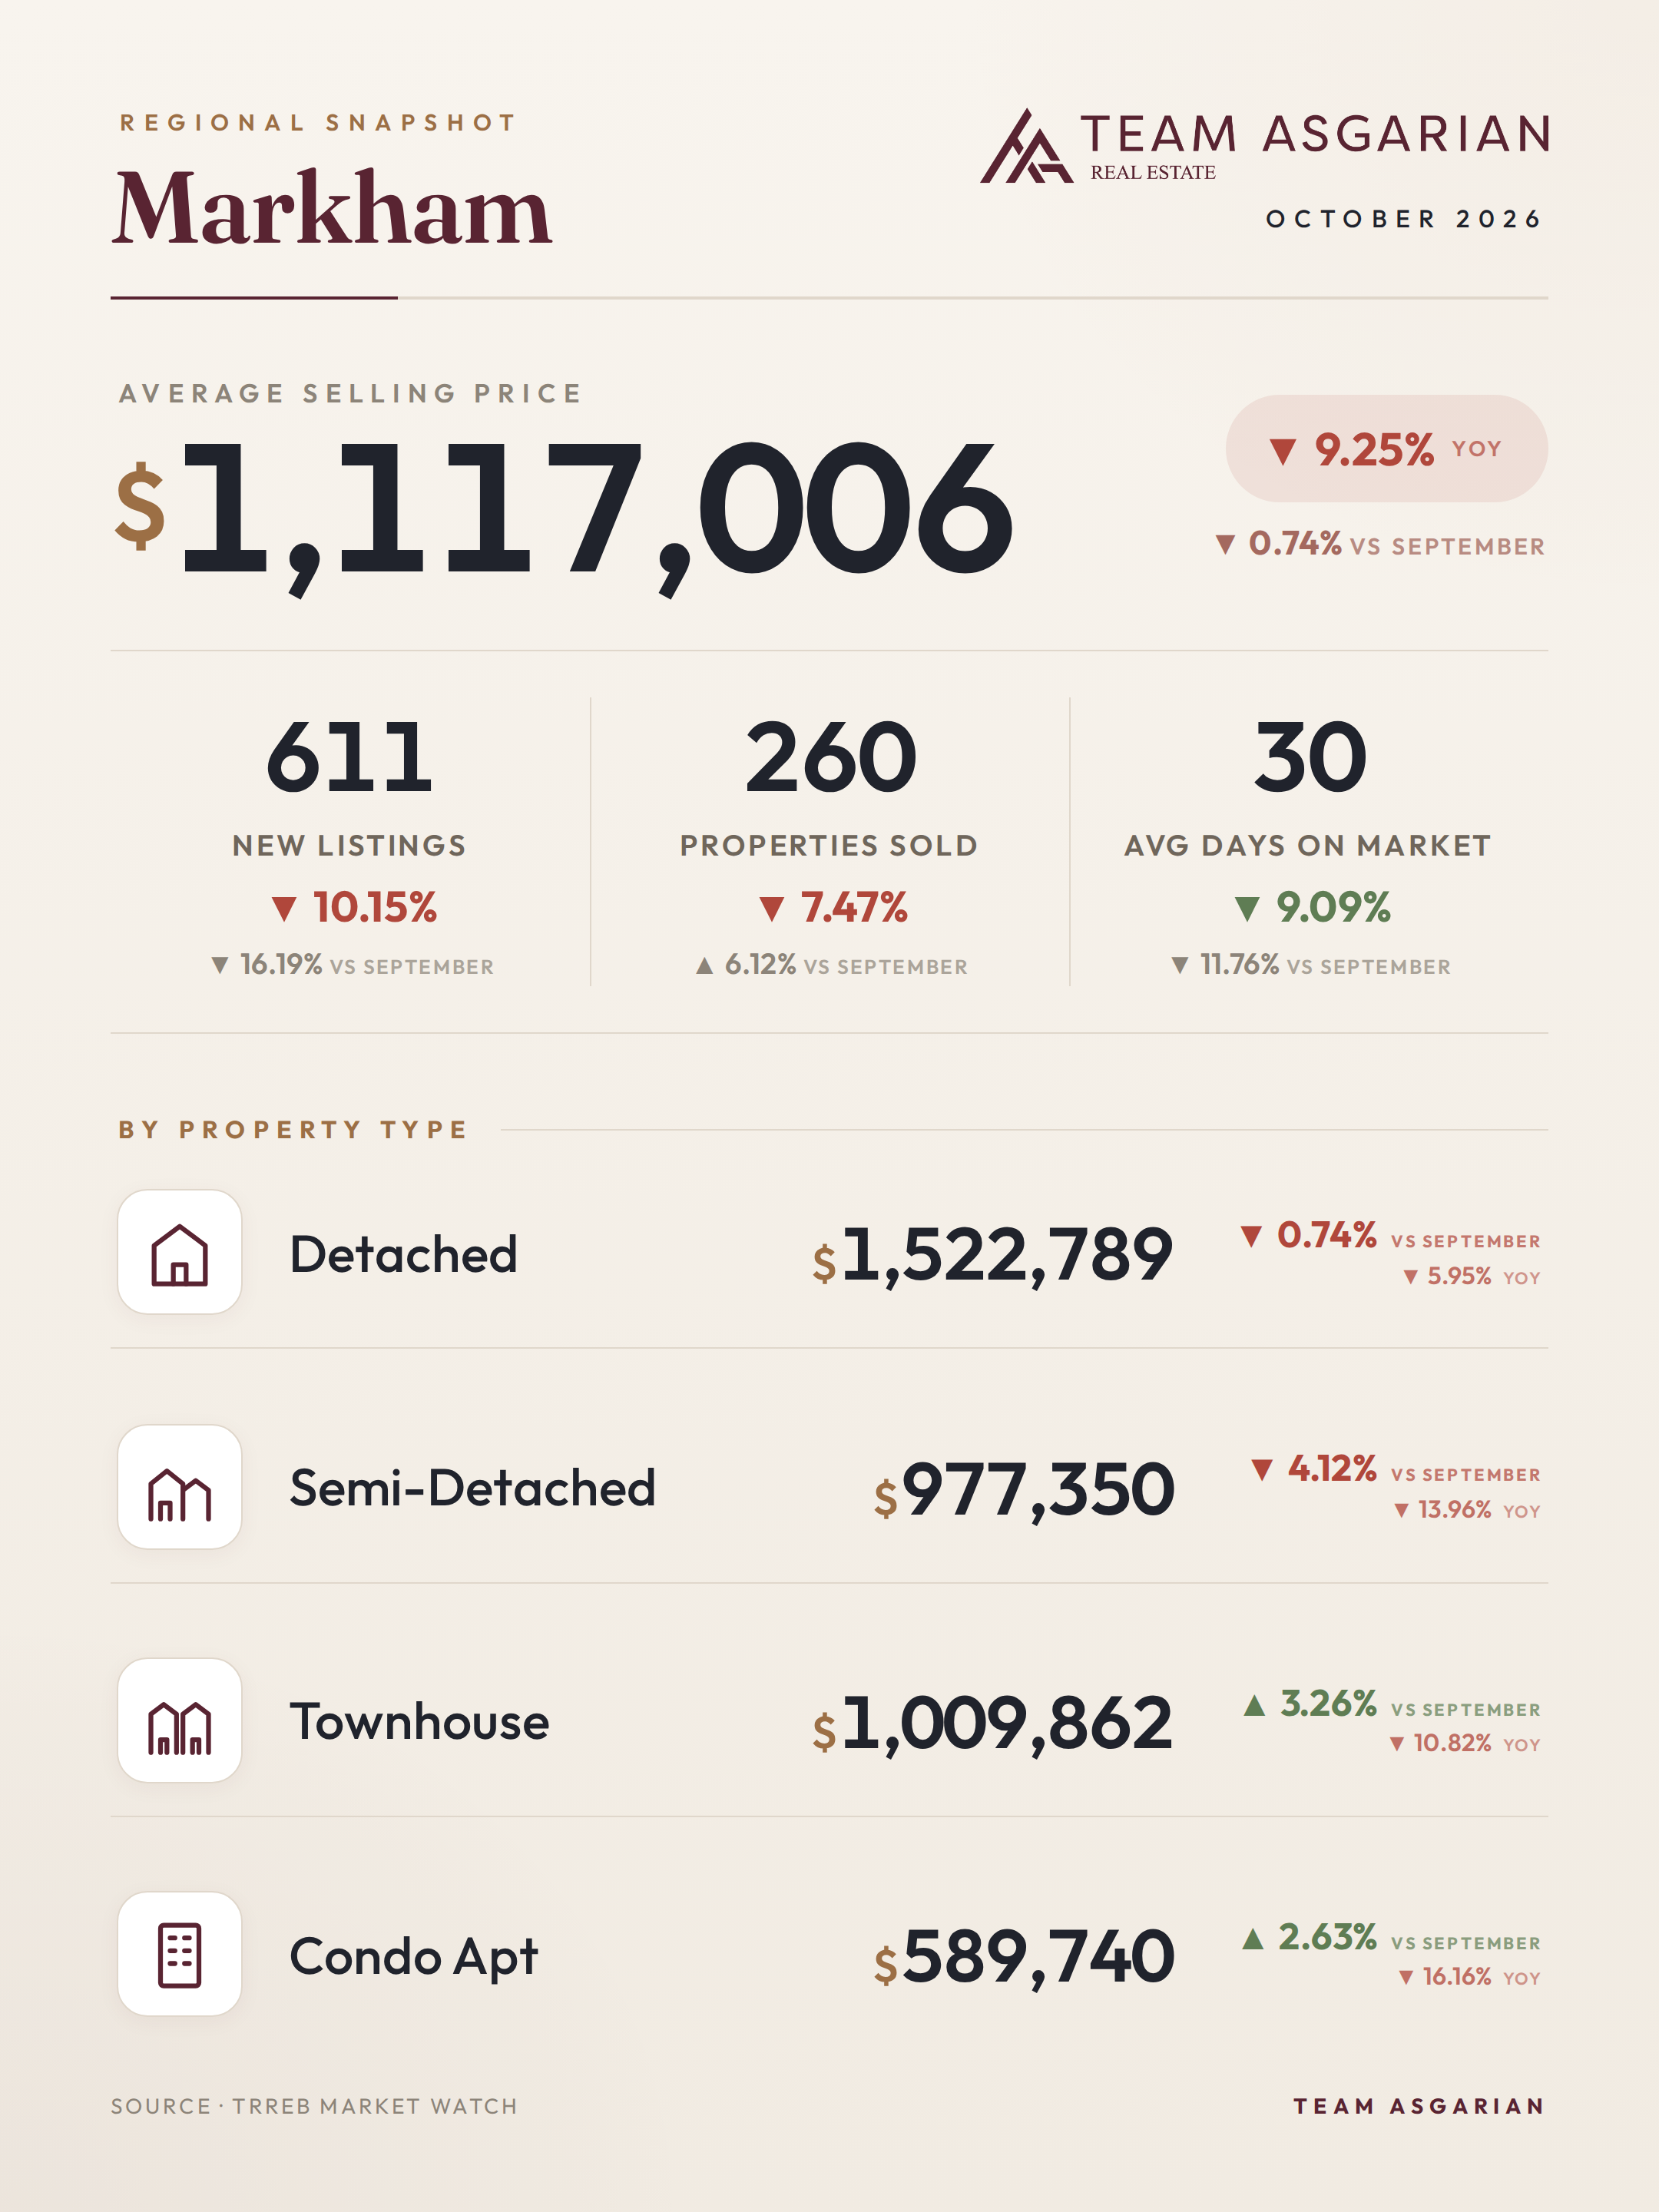
Markham was the only region we track where the average price fell from September. It landed at $1,117,006, down 0.74% for the month and 9.25% for the year. Demand wasn't the problem. Sales rose 6.12% month over month to 260, new listings fell 16.19% to 611, and homes sold in 30 days, faster than a year ago.
Semis and condos took the worst of it. Semis fell 13.96% to $977,350 and condo apartments fell 16.16% to $589,740. Townhouses averaged $1,009,862, down 10.82% for the year but up 3.26% from September. Detached homes averaged $1,522,789, down 5.95%.
The history explains a lot. Markham prices are 19.88% below October 2021 ($1,394,180), the biggest five-year drop of the seven regions, and only 9.73% above October 2016 ($1,017,966). Markham gave back much of its boom. For buyers, prices here are closer to pre-boom levels than in most of the GTA. If you bought in the last several years and you're thinking of selling, your profit may be thinner than you'd hope. Start from real numbers, not the one in your head.
By the numbers for Markham, October 2026: average selling price $1,117,006 (-9.3% year-over-year); 260 homes sold (-7.5%); 611 new listings (-10.2%); 30 average days on market. By type: Detached $1,522,789 (-6.0% YoY, -0.7% vs prior month), Semi-Detached $977,350 (-14.0% YoY, -4.1% vs prior month), Townhouse $1,009,862 (-10.8% YoY, +3.3% vs prior month), Condo $589,740 (-16.2% YoY, +2.6% vs prior month). Five years ago (October 2021) the average was $1,394,180: today's is 19.9% lower, with 45.8% fewer sales; ten years ago (October 2016) the average was $1,017,966: today's is 9.7% higher, with 52.5% fewer sales.
Are Richmond Hill prices back to 2016 levels?
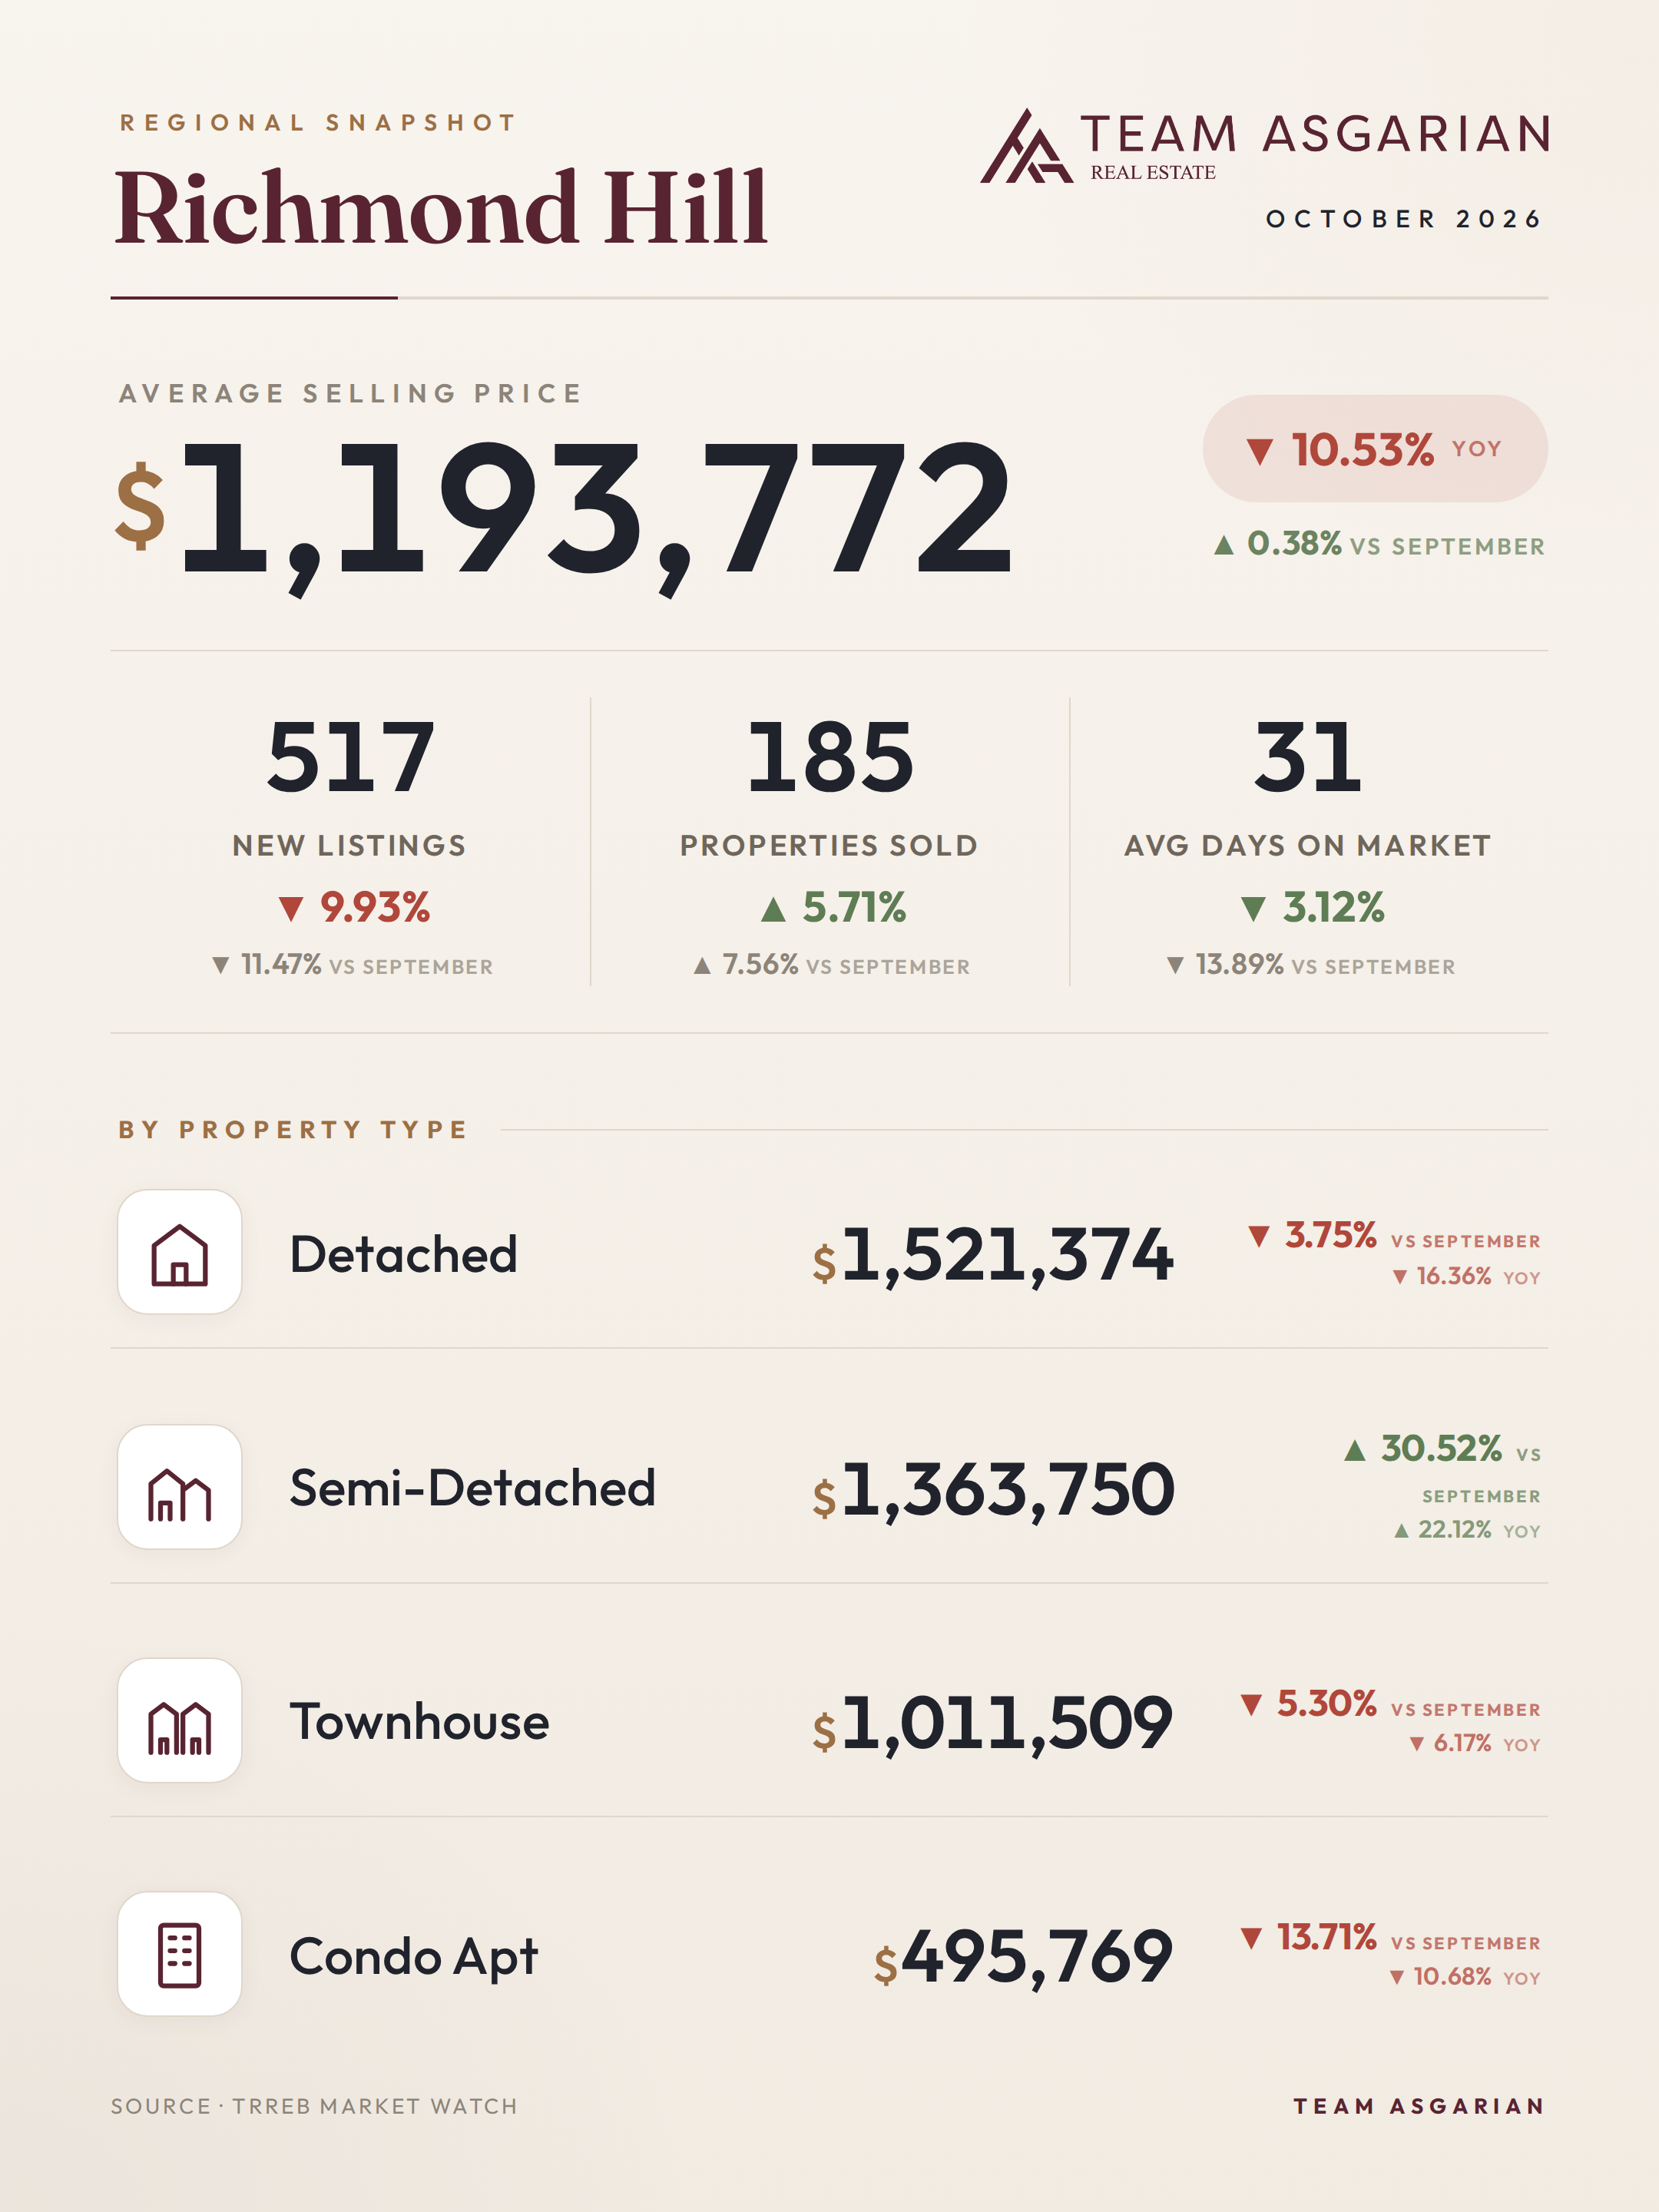
Very nearly. Richmond Hill averaged $1,193,772 in October 2026, down 10.53% from a year ago. That's only 4.88% above October 2016 ($1,138,259), the smallest ten-year gain of any region we track, and 18.77% below October 2021 ($1,469,550). Ten years, and prices have barely moved.
Buyers are coming back, though. 185 homes sold, up 5.71% from last October; only Richmond Hill and Newmarket beat last year's sales. New listings fell 9.93% to 517. Homes sold in 31 days on average, down from about 36 in September.
Detached homes averaged $1,521,374, down 16.36%, the biggest detached drop in this report. Condo apartments fell 10.68% to $495,769. Semis jumped 22.12% to $1,363,750, but very few semis trade here, and a handful of big ones can yank that average up. For buyers, a detached house in Richmond Hill is far better value than it was a few years ago. I'd be looking. For sellers: buyers are active, but they expect today's lower prices.
By the numbers for Richmond Hill, October 2026: average selling price $1,193,772 (-10.5% year-over-year); 185 homes sold (+5.7%); 517 new listings (-9.9%); 31 average days on market. By type: Detached $1,521,374 (-16.4% YoY, -3.8% vs prior month), Semi-Detached $1,363,750 (+22.1% YoY, +30.5% vs prior month), Townhouse $1,011,509 (-6.2% YoY, -5.3% vs prior month), Condo $495,769 (-10.7% YoY, -13.7% vs prior month). Five years ago (October 2021) the average was $1,469,550: today's is 18.8% lower, with 47.0% fewer sales; ten years ago (October 2016) the average was $1,138,259: today's is 4.9% higher, with 50.9% fewer sales.
Why are Aurora homes taking longer to sell?
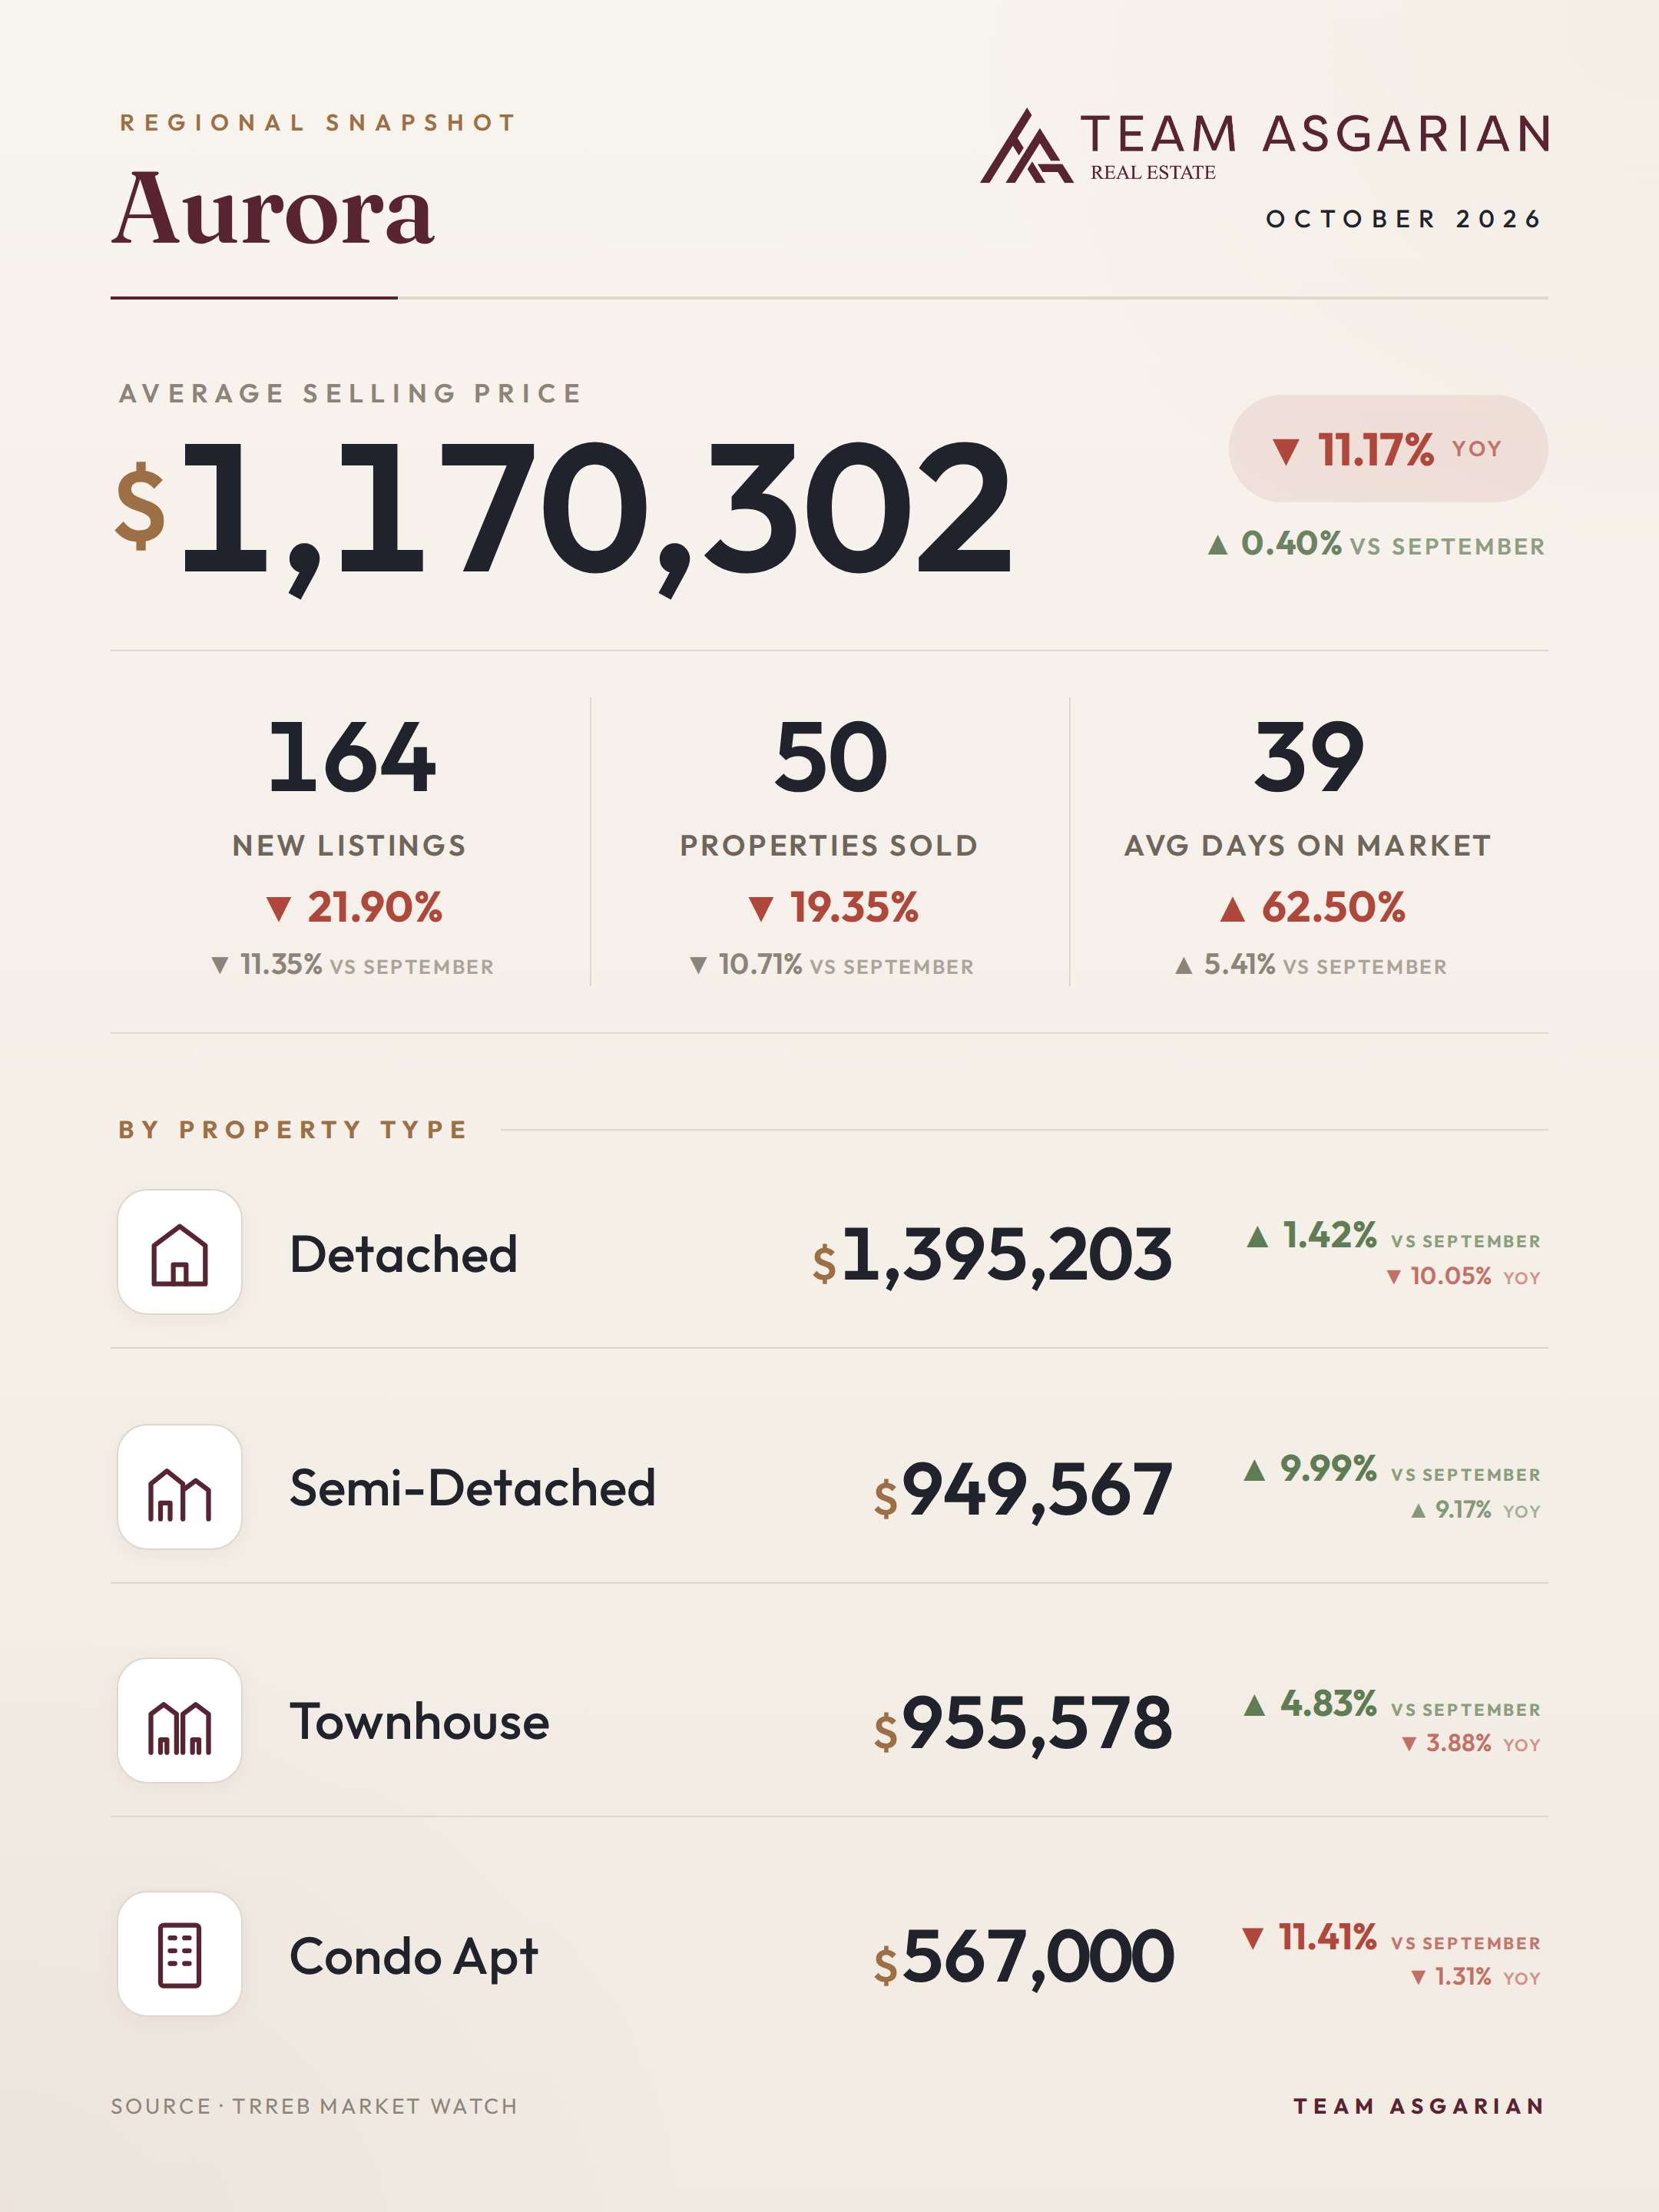
Aurora was the slowest market this month. Full stop. The average price fell 11.17% from a year ago to $1,170,302, the biggest annual drop here. Only 50 homes sold, down 19.35% from last October and 10.71% from September, and Aurora was the only region with fewer sales than in September. Homes took 39 days to sell, up from about 24 a year ago. That's a 62.5% increase. New listings fell 21.9% to 164, so sellers are sitting on their hands too.
Detached homes averaged $1,395,203, down 10.05%. Semis rose 9.17% to $949,567, townhouses averaged $955,578 (down 3.88%) and condos $567,000 (down 1.31%). Fifty sales in a month isn't much. A few homes can swing these averages, so treat them as a rough guide.
Aurora prices are 17.31% below October 2021 ($1,415,299) and 22% above October 2016 ($959,280). Sales are down 55.36% from five years ago, the biggest drop in activity of any region here. Buyers have more room to negotiate in Aurora than anywhere else in this report. Sellers need a realistic price and a home that shows well. Then patience.
By the numbers for Aurora, October 2026: average selling price $1,170,302 (-11.2% year-over-year); 50 homes sold (-19.4%); 164 new listings (-21.9%); 39 average days on market. By type: Detached $1,395,203 (-10.1% YoY, +1.4% vs prior month), Semi-Detached $949,567 (+9.2% YoY, +10.0% vs prior month), Townhouse $955,578 (-3.9% YoY, +4.8% vs prior month), Condo $567,000 (-1.3% YoY, -11.4% vs prior month). Five years ago (October 2021) the average was $1,415,299: today's is 17.3% lower, with 55.4% fewer sales; ten years ago (October 2016) the average was $959,280: today's is 22.0% higher, with 56.1% fewer sales.
Is Newmarket the busiest market in the GTA right now?
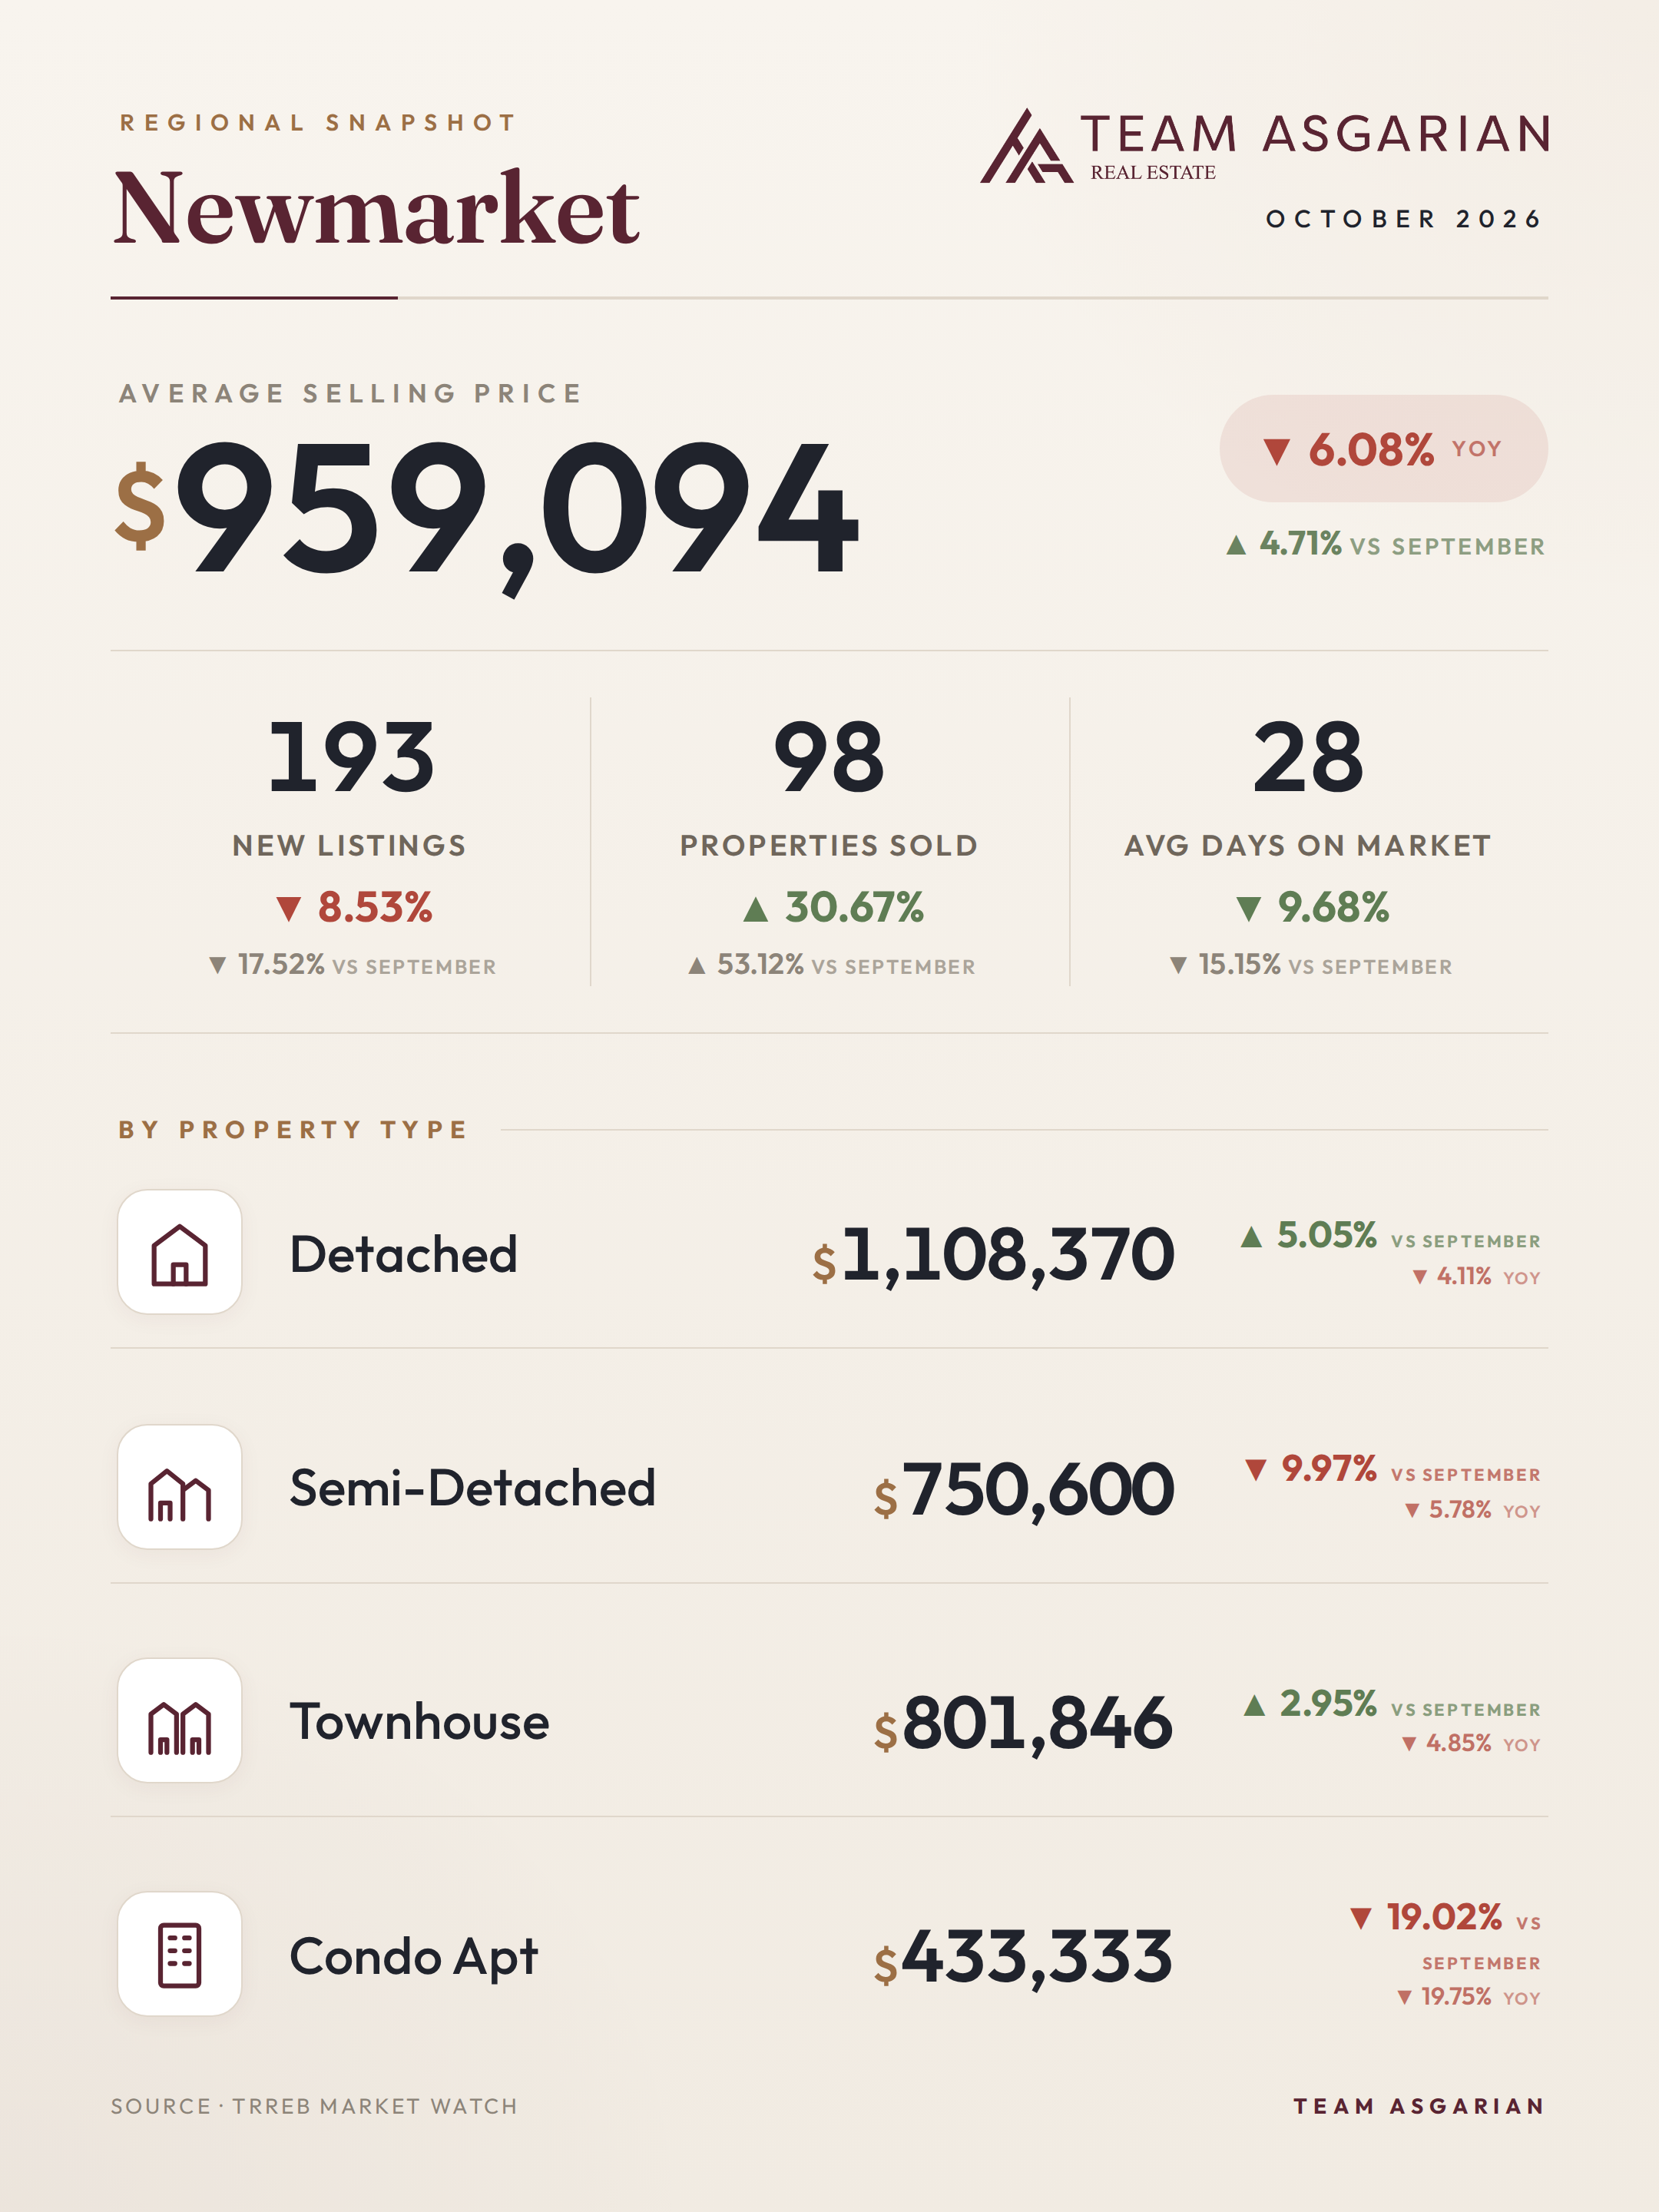
Of the regions we track, yes. 98 homes sold in Newmarket in October, up 30.67% from a year ago and 53.12% from September. Homes sold in 28 days on average, fastest of the seven. New listings fell 17.52% month over month to 193. The average price was $959,094, down 6.08% on the year, but it rose 4.71% from September, the biggest monthly gain of any region.
Detached homes averaged $1,108,370, down 4.11% for the year and up 5.05% for the month. Townhouses averaged $801,846, semis $750,600, and condo apartments $433,333, down 19.75%. Very few condos sell up here. Take that last number with a grain of salt.
Newmarket prices are 19.73% below October 2021 ($1,194,896) and 18.67% above October 2016 ($808,193). Sales are only 37.97% below 2021, the smallest drop of any region here, which means activity has come back further in Newmarket than anywhere else we track. For buyers, it has the lowest average detached price in this report, about $200,000 under the GTA average. My bet is that gap explains a lot of the traffic. Competition's picking up, so expect less wiggle room than next door in Aurora. For sellers, Newmarket has the strongest buyer activity going right now.
By the numbers for Newmarket, October 2026: average selling price $959,094 (-6.1% year-over-year); 98 homes sold (+30.7%); 193 new listings (-8.5%); 28 average days on market. By type: Detached $1,108,370 (-4.1% YoY, +5.0% vs prior month), Semi-Detached $750,600 (-5.8% YoY, -10.0% vs prior month), Townhouse $801,846 (-4.8% YoY, +3.0% vs prior month), Condo $433,333 (-19.8% YoY, -19.0% vs prior month). Five years ago (October 2021) the average was $1,194,896: today's is 19.7% lower, with 38.0% fewer sales; ten years ago (October 2016) the average was $808,193: today's is 18.7% higher, with 41.7% fewer sales.
Frequently Asked Questions
Are GTA home prices going up or down right now?
Depends which calendar you're holding. The GTA average was $1,024,108 in October 2026: down 2.87% from October 2025, up 1.76% from September. Go back further and prices are 11.36% below October 2021 and 34.23% above October 2016. One good month isn't a trend. I've seen too many false starts to call it one. But yes, prices did rise from September.
Is now a good time to buy a condo in Toronto?
Condos are the soft spot. City of Toronto condo apartments averaged $659,214 in October 2026, down 5.72% from a year ago (up 2.96% from September, to be fair). GTA-wide they averaged $621,400, down 5.88%, the biggest drop of the four property types. So you have more room to negotiate on a condo than on anything else. My advice hasn't changed in 20 years: buy when your life says it's time. Nobody rings a bell at the bottom.
Is it a good time to sell a house in the GTA?
Better than it was in September. Sales rose 11.17%, new listings fell 14.1%, and the average home sold in 31 days instead of about 34. Prices are still under last year's, though. GTA detached homes averaged $1,310,627, down 3.31%. Price off what's selling this month. Pricing off last year's number is how a listing goes stale.
Which GTA cities had the biggest price drops in October 2026?
Aurora took the biggest hit year over year, down 11.17% to $1,170,302. Richmond Hill was next (down 10.53% to $1,193,772), then Markham (down 9.25% to $1,117,006). The City of Toronto was the only one up, by 0.54%. One caveat. Smaller towns don't have many sales, so a few homes can drag an average around a lot.
How does today's GTA market compare to 2021?
October 2021: GTA average $1,155,345, with 9,783 sales. October 2026: $1,024,108, with 5,603 sales. That's 11.36% lower on price and 42.73% lower on sales. Buyers today face a fraction of the competition they did in the bidding-war years. If you bought near that peak, look hard at what homes like yours are selling for today before you list.